In my last blog, I discussed the growing commitment among governors to infrastructure investment, and to coming up with innovative ways to find dollars to fund the needed improvements to the transportation network.
I heard it over and over again during the Transportation Research Board (TRB) Annual Meeting in January and again during the American Association of State and Highway Transportation Officials (AASHTO) Washington Briefing in February. State DOTs are drowning in data. They have data on traffic flow and volume, crashes, weather, road use, equipment and assets, freight, commercial vehicles, driver’s licensing and motor vehicle registrations, and now many include economic development, community and land use data, as well.
The question on many state DOT leaders minds is how to use the data in a way that not only helps them make day-to-day and long term operational decisions but also, as recommended by several panelists at the AASHTO meeting, to communicate with elected officials at the federal, state and local level as well as transportation advocacy groups and road users.
Data visualization is a term that keeps cropping up in the transportation world. And at both the TRB and AASHTO meeting, panelists urged state DOT executives to find compelling ways to share their data visually to tell their story to core audiences including members of congress, US Department of Transportation staff and their customers.
And while simply showing their data is important, the real power resides in having the ability to:
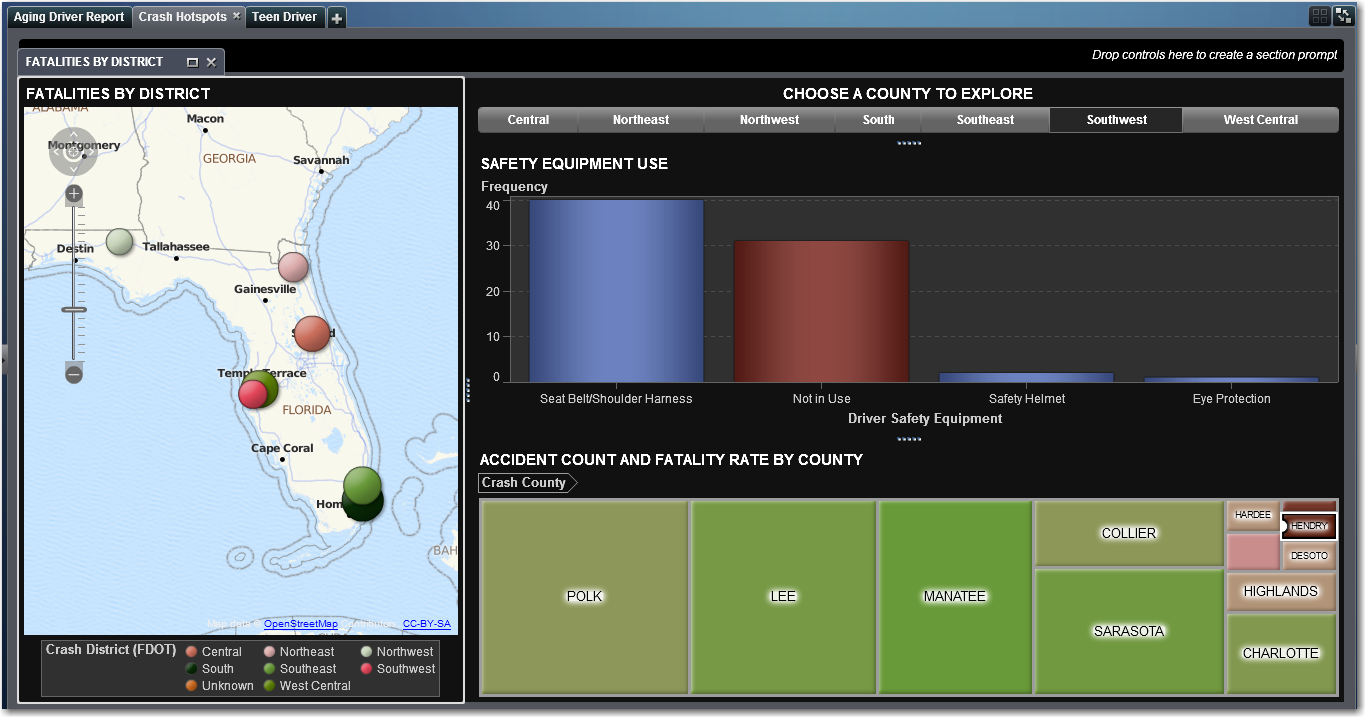
- interactively explore the data in minutes or even seconds
- apply predictive and descriptive analytics to data of any size to spot previously unknown patterns identify key relationships
- uncover insights that would otherwise stay hidden
State DOT IT department are busy places—frequently facing backlogs of requests for ad hoc reports that can take days to produce. Data visualization can offer state DOT executives fast access to their data on mobile devices while they are meeting with their congressional delegation. Users can explore data on their own and easily create new ways of looking at data and dynamically filtering and grouping variables which can help reveal insights that might spark further analysis.
Gone are the days of static PDF annual reports. With data visualization, DOT leaders can provide governors and other state leaders with up-to-date, more accurate information that they need to follow through on their commitments to infrastructure improvement.