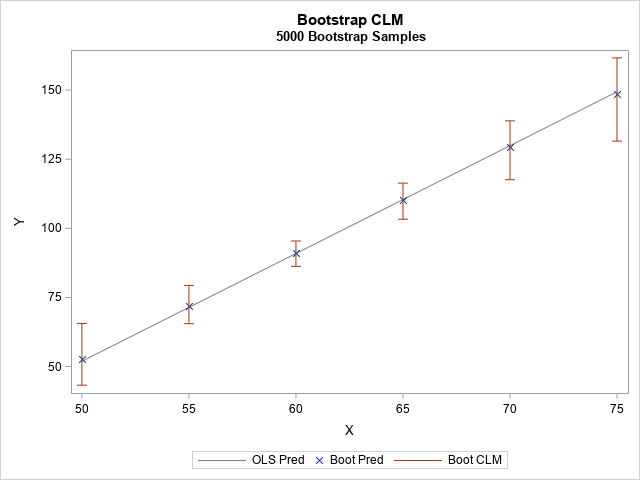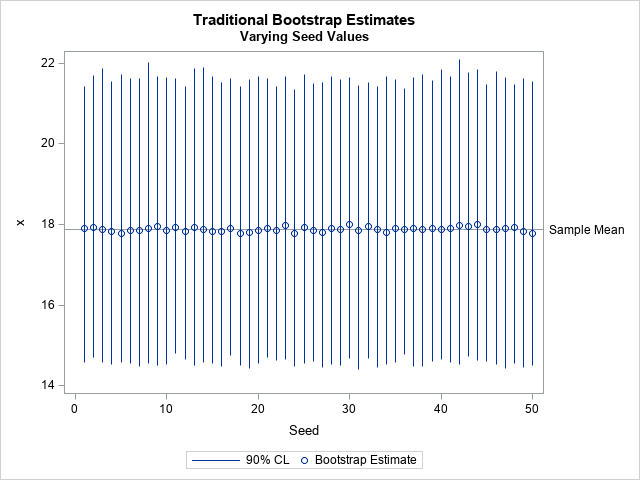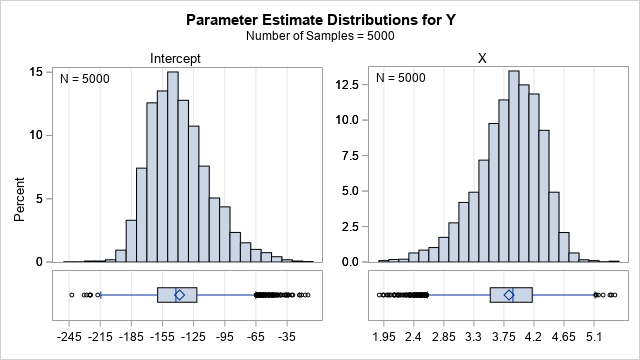
I previously wrote about how to compute a bootstrap confidence interval in Base SAS. As a reminder, the bootstrap method consists of the following steps: Compute the statistic of interest for the original data Resample B times from the data to form B bootstrap samples. B is usually a large
Tag: Bootstrap and Resampling
One way to assess the precision of a statistic (a point estimate) is to compute the standard error, which is the standard deviation of the statistic's sampling distribution. A relatively large standard error indicates that the point estimate should be viewed with skepticism, either because the sample size is small
Last week I showed how to use the simple bootstrap to randomly resample from the data to create B bootstrap samples, each containing N observations. The simple bootstrap is equivalent to sampling from the empirical cumulative distribution function (ECDF) of the data. An alternative bootstrap technique is called the smooth
A common question is "how do I compute a bootstrap confidence interval in SAS?" As a reminder, the bootstrap method consists of the following steps: Compute the statistic of interest for the original data Resample B times from the data to form B bootstrap samples. How you resample depends on
Many simulation and resampling tasks use one of four sampling methods. When you draw a random sample from a population, you can sample with or without replacement. At the same time, all individuals in the population might have equal probability of being selected, or some individuals might be more likely
How do you sample with replacement in SAS when the probability of choosing each observation varies? I was asked this question recently. The programmer thought he could use PROC SURVEYSELECT to generate the samples, but he wasn't sure which sampling technique he should use to sample with unequal probability. This
My colleagues at the SAS & R blog recently posted an example of how to program a permutation test in SAS and R. Their SAS implementation used Base SAS and was "relatively cumbersome" (their words) when compared with the R code. In today's post I implement the permutation test in
Bootstrap methods and permutation tests are popular and powerful nonparametric methods for testing hypotheses and approximating the sampling distribution of a statistic. I have described a SAS/IML implementation of a bootstrap permutation test for matched pairs of data (an alternative to a matched-pair t test) in my paper "Modern Data
Last week I showed three ways to sample with replacement in SAS. You can use the SAMPLE function in SAS/IML 12.1 to sample from a finite set or you can use the DATA step or PROC SURVEYSELECT to extract a random sample from a SAS data set. Sampling without replacement
Randomly choosing a subset of elements is a fundamental operation in statistics and probability. Simple random sampling with replacement is used in bootstrap methods (where the technique is called resampling), permutation tests and simulation. Last week I showed how to use the SAMPLE function in SAS/IML software to sample with
With each release of SAS/IML software, the language provides simple ways to carry out tasks that previously required more effort. In 2010 I blogged about a SAS/IML module that appeared in my book Statistical Programming with SAS/IML Software, which was written by using the SAS/IML 9.2. The blog post showed
A challenge for statistical programmers is getting data into the right form for analysis. For graphing or analyzing data, sometimes the "wide format" (each subject is represented by one row and many variables) is required, but other times the "long format" (observations for each subject span multiple rows) is more
I was recently asked the following question: I am using bootstrap simulations to compute critical values for a statistical test. Suppose I have test statistic for which I want a p-value. How do I compute this? The answer to this question doesn't require knowing anything about bootstrap methods. An equivalent
In a previous post, I described how to compute means and standard errors for data that I want to rank. The example data (which are available for download) are mean daily delays for 20 US airlines in 2007. The previous post carried out steps 1 and 2 of the method
I recently posted an article about representing uncertainty in rankings on the blog of the ASA Section for Statistical Programmers and Analysts (SSPA). The posting discusses the importance of including confidence intervals or other indicators of uncertainty when you display rankings. Today's article complements the SSPA post by showing how
In a previous post, I used statistical data analysis to estimate the probability that my grocery bill is a whole-dollar amount such as $86.00 or $103.00. I used three weeks' grocery receipts to show that the last two digits of prices on items that I buy are not uniformly distributed.
My previous post on creating a random permutation started me thinking about word games. My wife loves to solve the daily Jumble® puzzle that runs in our local paper. The puzzle displays a string of letters like MLYBOS, and you attempt to unscramble the letters to make an ordinary word.