SAS Innovate on Tour Tokyo 2025 開催のご報告
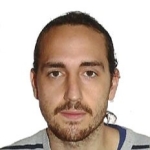
2025年7月24日(木)に開催された「SAS Innovate on Tour Tokyo 2025」は、大盛況のうちに無事閉幕いたしました。ご来場いただいた皆さまに、心より御礼申し上げます。また、スポンサーの皆さま、そして運営・制作・広報をはじめとする関係各位の多大なるご支援とご尽力に、深く感謝申し上げます。 開催報告として、弊社代表 手島 主税からの基調貢献に関するメッセージを以下に投稿させていただきます。 SASジャパン創立40周年を迎える節目の年に開催致しました「SAS Innovate on Tour Tokyo 2025」ですが、私が代表を担当させていただいてから3度目となりました。この3年間、毎年ご来場いただく規模が増えておりまして、今年は過去最大の規模で終えることができました。改めまして皆様に心から感謝申し上げます。 意志決定と人との関係性の力をデータ&AIで紐付ける、「人中心型イノベーション」のビジョンのもと、意志決定に携わる経営者とフロントラインワーカー(営業、マーケティング、工場長、主計など)が求める具体的なテーマでお届けしました。 SASは「データはそれ自体では価値を生まない。価値を生むのは意志決定である」という信念のもと、多様化したAIのモデルを統計的な手法と機械・強化学習の組み合わせを実行できる高度なアナリティクス技術を進化させてきました。重要なのは、データをいかに意志決定に結びつけ、行動変容を促すかという「プロセス」です。 私たちが提唱する「意志決定のデータパイプライン」は、ビジネス部門の課題提起から逆算して必要なデータを整備するアプローチです。システム先行ではなく、人の知見や問いを起点にすることで、真に活用されるデータ基盤を構築できます。SASは、意味付けされたデータを各部門に合わせて提供し、お客様の意志決定を支援しています。 今年の基調講演では、日本を代表する経営者、DX推進リーダー、アカデミアのリーダーの皆様とスペシャルゲストとしてお迎えし、示唆に富んだパネルディスカッションを実施しました。 最初のパネルでは、ソニー銀行様、中国銀行様、東京海上ホールディングス様の経営リーダーがご登壇。 益々過去に無い規模でデータが生成されていく時代になり、企業の価値を創り出す宝探しである。またこれから現場への権限移譲とデータリテラシーの底上げを進めながら、最終的な価値を生むのは人のシナリオ、判断力であることが改めて強調されました。特に印象的だったのは、金融商品に“共感価値”を織り込むという発想の転換。金融を単なる機能価値から、人の感性に響く体験へと昇華させる挑戦が語られました。 [パネルディスカッションご登壇者(※登壇順)] ソニー銀行株式会社 南 啓二様 株式会社中国銀行 山縣 正和様 東京海上ホールディングス株式会社 生田目 雅史様 株式会社ソウジョウデータ 西内 啓様 未来の学びの探求’Future Ready’のパネルでは、統計学で多くの著書、大学での教えも推進されてきている西内先生をお迎えし、「問いを立てる力」がAI活用の出発点であること、そして経営から現場まで“問い→仮説→検証”のリズムを組織全体で回すことの重要性が共有されました。 また、アストラゼネカ堀江様、NSW竹村様にもご登壇頂きました。 堀江様には最新のSASのテクノロジー、AIを活用いただいたモダイナイゼーションによるコスト最適化とフロントワーカーの効率性アップの具体的な事例をご紹介いただき、多くの方に反響を頂きました。 [関連記事] アストラゼネカが目指す医療・創薬の新たなステージ──実現に不可欠なデータサイエンス部の役割とは? 竹村様には、新たなSASとの製造業界向けの戦略的パートナーアライアンスの発表をご披露いただき、昨今の製造業界における課題へのソリューション(工場と経営DX)をご紹介頂きました。これからの両社によるパートナーシップに弊社も大きく期待しております。 [関連記事] NSW株式会社様との協業の発表について - SAS Japan 私個人的にも、日本を牽引する各業界のリーダー皆様の志、視座の高さ、人間力に感銘致しました!!改めまして、南様、山縣様、生田目様、堀江様、竹村様に感謝申し上げます。皆様のビジョンの具現化の力になるべく、引続きSASジャパンも社を挙げて果敢に挑戦してまいります。 これからのSASジャパンに乞うご期待ください。 SAS Institute Japan株式会社