Graphically Speaking
Data Visualization with a focus on SAS ODS Graphics
Many cities have Open Data pages. But once you download the data, what can you do with it? This is my second blog post where I download several datasets from Cary, NC's open data page, and and give you a few ideas to get you started on your own data

Many cities have Open Data pages. But once you download this data, what can you do with it? I'm going to download several datasets from Cary, NC's open data page, and try to give you a few ideas to get you started on your own data exploration! And what data

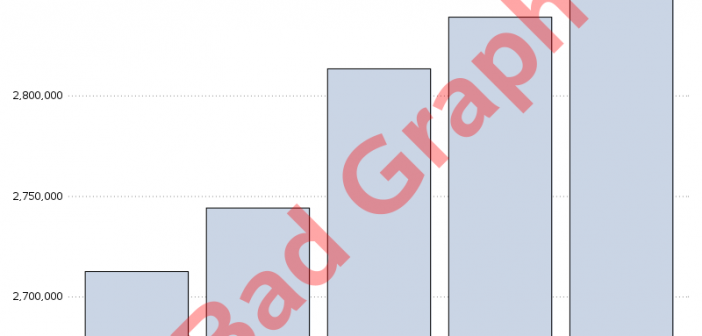
Some claim that deaths in the US have been increasing, and some claim they have been decreasing. Which do you think is correct? Let's take a look at the data ... The Data Here in the US, the Centers for Disease Control and Prevention is a good/official source of data
