Graphically Speaking
Data Visualization with a focus on SAS ODS Graphics
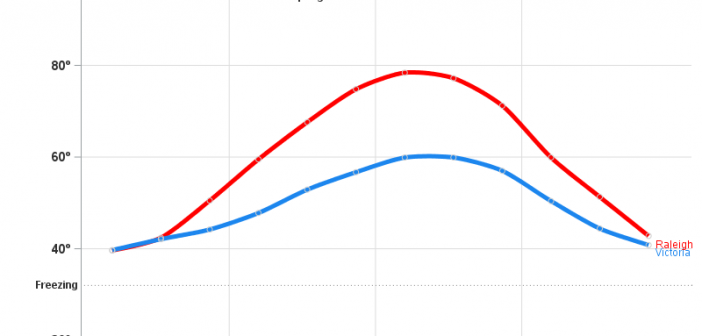
If someone proposes a bet to you, then you should be suspicious that they already know they're going to win. And one frequent topic of such bets is the weather... What if I bet you there's a city in Canada with a warmer average January temperature than Raleigh, NC? You

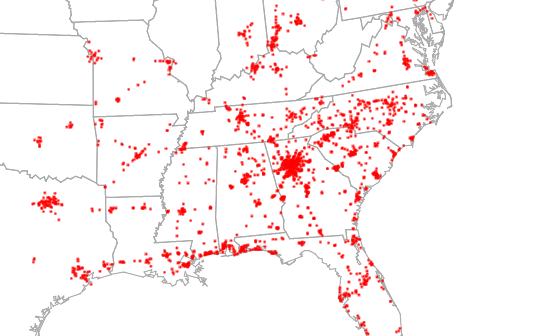
Do you find yourself on the road during the holidays, and looking for a place to eat that's still open? Or perhaps you're like me - I don't cook at home, and I'm not really into visiting family for the holidays and eating with them. Well then, you probably know

The Rise of Skywalker, the final movie in the third set of the three Star Wars trilogies, will finally be released tomorrow (December 20, 2019). That's 9 movies, in about 42 years. And, if the first movies aren't still fresh in your mind (or perhaps you weren't even born when
