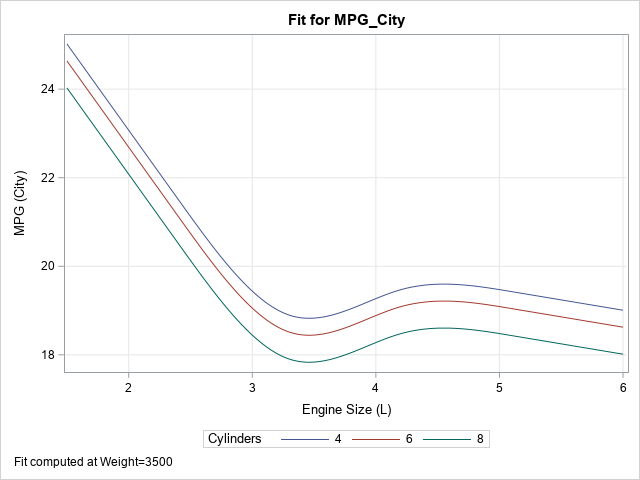
Author

Rick Wicklin
RSS
Distinguished Researcher in Computational Statistics

Rick Wicklin, PhD, is a distinguished researcher in computational statistics at SAS and is a principal developer of SAS/IML software. His areas of expertise include computational statistics, simulation, statistical graphics, and modern methods in statistical data analysis. Rick is author of the books Statistical Programming with SAS/IML Software and Simulating Data with SAS.

Learn SAS
Rick Wicklin 0
How to vectorize time series computations

Vector languages such as SAS/IML, MATLAB, and R are powerful because they enable you to use high-level matrix operations (matrix multiplication, dot products, etc) rather than loops that perform scalar operations. In general, vectorized programs are more efficient (and therefore run faster) than programs that contain loops. For an example

Rick Wicklin 0
A Christmas tree matrix

O Christmas tree, O Christmas tree, Last year a fractal made thee! O Christmas tree, O Christmas tree, A heat map can display thee! O tree of green, adorned with lights! A trunk of brown, the rest is white. O Christmas tree, O Christmas tree, A heat map can display

Rick Wicklin 0
Visualize a matrix in SAS by using a discrete heat map

A heat map is a graphical representation of a matrix that uses colors to represent values in the matrix cells. Heat maps often reveal the structure of a matrix. There are three common applications of visualizing matrices with heat maps: Visualizing a correlation or covariance matrix reveals relationships between variables.

Learn SAS
Rick Wicklin 0
The GCD and LCM functions in SAS

My daughter's middle school math class recently reviewed how to compute the greatest common factor (GCF) and the least common multiple (LCM) of a set of integers. (The GCF is sometimes called the greatest common divisor, or GCD.) Both algorithms require factoring integers into a product of primes. While helping

Rick Wicklin 0
How to specify mosaic plot colors in SAS

The mosaic plot is a graphical visualization of a frequency table. In a previous post, I showed how to use the FREQ procedure to create a mosaic plot. This article shows how to create a mosaic plot by using the MOSAICPARM statement in the graph template language (GTL). (The MOSAICPARM

Rick Wicklin 0
Create mosaic plots in SAS by using PROC FREQ

Mosaic plots (Hartigan and Kleiner, 1981; Friendly, 1994, JASA) are used for exploratory data analysis of categorical data. Mosaic plots have been available for decades in SAS products such as JMP, SAS/INSIGHT, and SAS/IML Studio. However, not all SAS customers have access to these specialized products, so I am pleased

Learn SAS
Rick Wicklin 0
Rotating matrices

This article is about rotating matrices. No, I don't mean "rotation matrices," I mean rotating matrices. As in turning a matrix 90 degrees in a clockwise or counterclockwise direction. I was reading a program written in MATLAB in which the programmer used a MATLAB function called ROT90, which rotates a

Rick Wicklin 0
Why it's okay to guess on the SAT test

Should you ever guess on the SAT® or PSAT standardized tests? My son is getting ready to take the preliminary SAT (PSAT), which is a practice test for the SAT. A teacher gave his class this advice regarding guessing: For a multiple-choice questions, if you can eliminate one or two

Rick Wicklin 0
Two applications of the "runs test"

In my last blog post I described how to implement a "runs test" in the SAS/IML language. The runs test determines whether a sequence of two values (for example, heads and tails) is likely to have been generated by random chance. This article describes two applications of the runs test.

Rick Wicklin 0
The first MOOC in statistics

Massive open online courses (MOOCs) are all the rage today. Some people see free online courses as a convenient way to introduce statistical concepts to tens of thousands of students who would not otherwise have an opportunity to learn about data analysis. Whereas 2013 is the International Year of Statistics,

1 36 37 38 39 40 53