On the reproducibility of responses by AI assistants

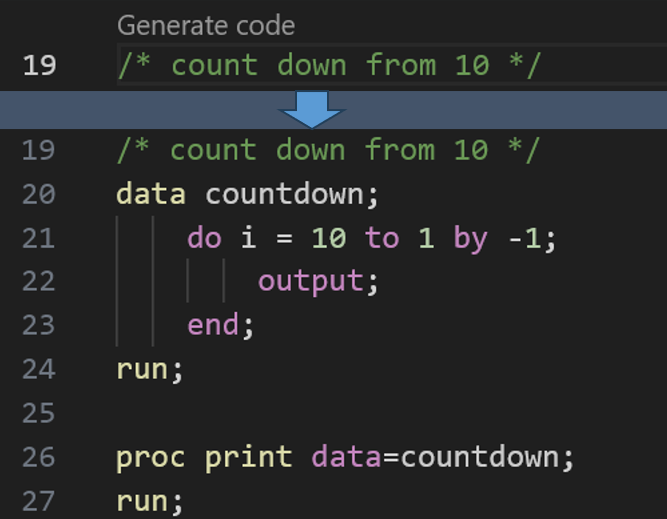
As announced and demonstrated at SAS Innovate 2024, SAS plans to include a generative AI assistant called SAS Viya Copilot in the forthcoming SAS Viya Workbench. You can submit a text prompt (by putting it in a comment string) and the Copilot will generate SAS code for you. My colleagues