Fit, simulate, fit: How models can collapse after generations of recursive fitting

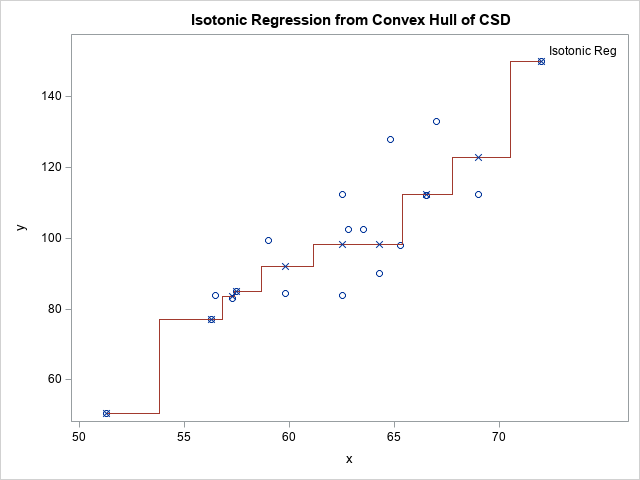
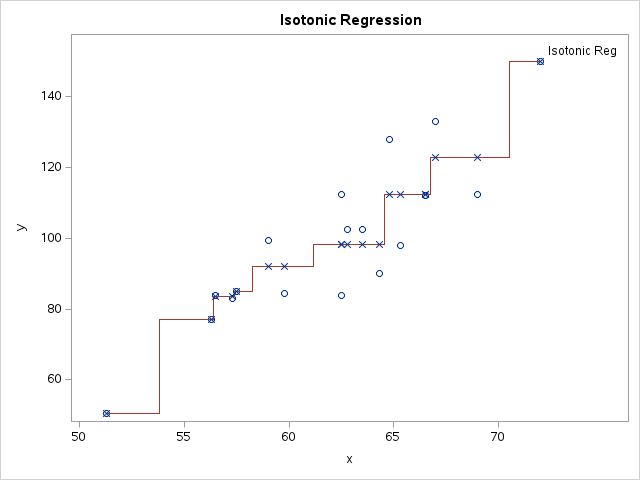
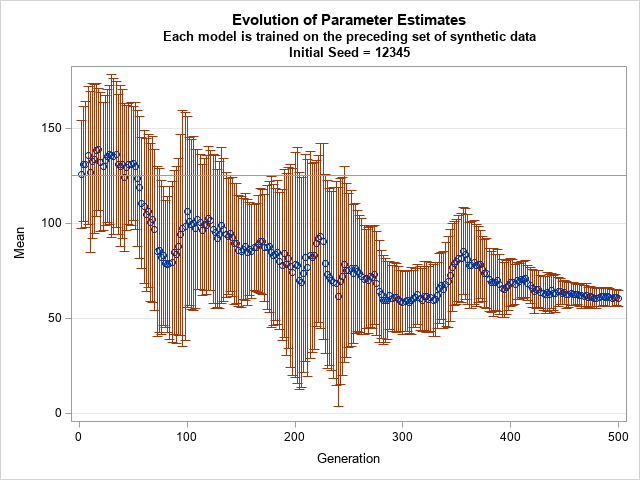
An article published in Nature has the intriguing title, "AI models collapse when trained on recursively generated data." (Shumailov, et al., 2024). The article is quite readable, but I also recommend a less technical overview of the result: "AI models fed AI-generated data quickly spew nonsense" (Gibney, 2024). The Gibney