All Posts


Errors. We all make them. After all, “to err is human.” Or, as programmers often say, “To err is human, but to really foul things up requires a computer” (Farmer’s Almanac, 1978). This post describes how to interpret error messages from PROC IML that appear in the SAS log. The


Update 25Nov2010: I've updated this example to correct the code so that it works correctly for positive UTC offsets. Thanks to Bruno Müller, my colleague at SAS, for finding my mistakes. One of my SAS colleagues was recently working on a project where she had to create reports that include
Many people mistakenly assume that just because you want to use a SAS program to access a protected resource (such as a database table), you must include the credentials for the resource inside your program. Few things cause a database administrator to lose more sleep than coming across this within
I am thankful to be a statistical programmer. When I wake up in the morning, I am eager to start my day. I love statistics, programming, and working at SAS, and I write my blog to share that joy. This a Golden Age for statistical programmers because theoretical ideas and

It was over two years ago that I shared the tip of using Process Explorer to look under the covers at which SAS processes were running on your Windows environment. Process Explorer recently received a refresh, and it's worth downloading the new version. (Yes, it's free.) If you want to
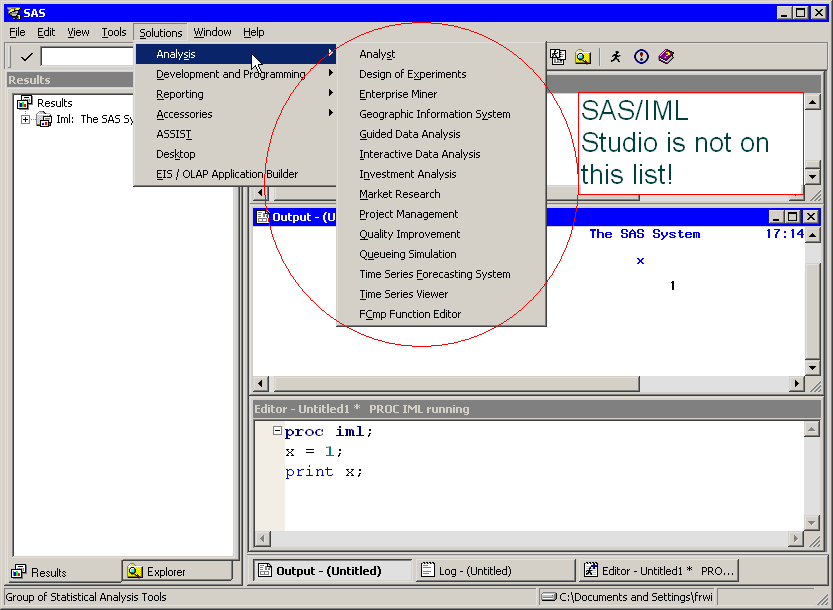
I give many presentations and workshops on how to use SAS/IML Studio, and more than once I have been asked about how to launch the program. Sometimes the inquiry hints at mild frustration, such as last week's "How do I RUN the $%#@# THING!!!!" The email I got this week


The recent mail bomb attempt on US-bound cargo and commercial airliners is another reminder of the terrorist threat the United States continues to face. While there may be a lull in the news cycles from time to time, the threat is there every day. A key component in detecting and

I was building a nice little PDF report the other day. I love the way ODS PDF replicates the SAS Results window navigation structure as PDF bookmarks, but... I'd much rather write the text for the bookmarks myself. So, I decided to "use the SAS" and make ODS do my


Many SAS users receive data in the form of CSV (Comma Separated Value) files, and need to convert them to SAS data sets. A typical record in a CSV file might look like this: Jeter,Derek,1995,,234,”22,600,000” Note the following about the record above: There is no data for the fourth field,
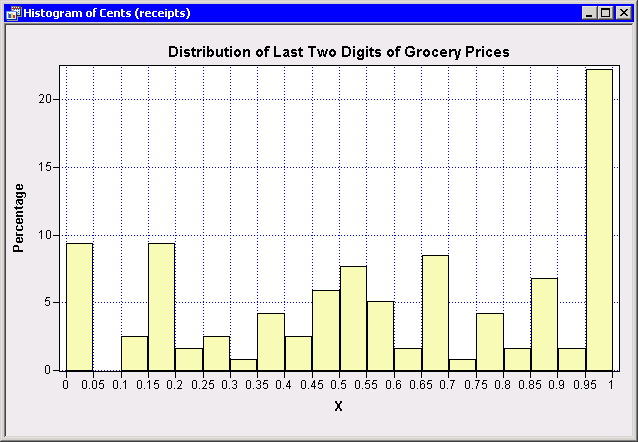
In a previous post, I used statistical data analysis to estimate the probability that my grocery bill is a whole-dollar amount such as $86.00 or $103.00. I used three weeks' grocery receipts to show that the last two digits of prices on items that I buy are not uniformly distributed.

In a previous post, I discussed computing regression coefficients in different polynomial bases and showed how the coefficients change when you change the basis functions. In particular, I showed how to convert the coefficients computed in one basis to coefficients computed with respect to a different basis. It turns out
Are you afraid of big commitments? Do you like to shop around thoroughly before making a purchase decision? I can't help you with most of Life's Big Choices, but I can help you in one way: I can show you how to learn more about your data set before you
I am pleased to announce that the fine folks at SAS Press have made Chapter 2 of my book, Statistical Programming with SAS/IML Software available as a free PDF document. The chapter is titled "Getting Started with the SAS/IML Matrix Programming Language," and it features More than 60 fully functional
The other day I was at the grocery store buying a week's worth of groceries. When the cashier, Kurt (not his real name), totaled my bill, he announced, "That'll be ninety-six dollars, even." "Even?" I asked incredulously. "You mean no cents?" "Yup," he replied. "It happens." "Wow," I said, with

Chris started a tradition for SAS Press authors to post a photo of themselves with their new book. Thanks to everyone who helped with the production of Statistical Programming with SAS/IML Software.