Sometimes, I pick something fun to do with SAS/GRAPH so that I can learn and experiment with some of the more obscure functionality that I'm wanting to master. This is one of those situations. This fun graph allowed me to experiment with crosshatch patterns in maps, overlapping map areas and creating 'holes' in maps.
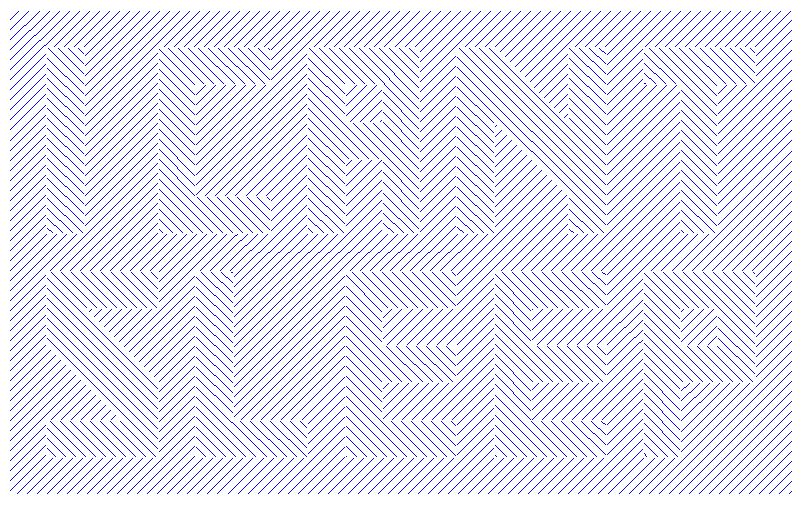
The following is actually SAS/GRAPH 'Proc GMap' output!
Can you read the hidden message?!
What I learned:
- You have to specify GMap crosshatch patterns in the pattern statement 'differently' than you do for GChart.
- You can create 'holes' in a GMap by specifying 'SAS missing' values in the prior observation.
- Since cross-hatch patterns have "see through" backgrounds, if you're overlapping map areas that have crosshatching and don't want the patterns to be combined, then you should also overlap a same-shaped solid white map area between them.
Here's the code I used if you want to try this at home:
<pre>
%let name=psychedelic;
filename odsout '.';

/*
Similar to
http://sphotos.xx.fbcdn.net/hphotos-snc7/310824_264018990302225_100000823797837_652046_46651538_n.jpg
*/

data background;

value=1;
letter=0;
x=0; y=0; output;
x=210; output;
y=130; output;
x=0; output;

run;

/* make the holes for the letters */

/*
x=.; y=.; output;
x=10; y=70; output;
x=20; y=70; output;
x=20; y=120; output;
x=10; y=120; output;

x=.; y=.; output;
x=40; y=70; output;
x=70; output;
y=80; output;
x=50; output;
y=110; output;
x=70; output;
y=120; output;
x=40; output;

x=.; y=.; output;
x=80; y=70; output;
x=90; output;
y=90; output;
x=100; output;
y=70; output;
x=110; output;
y=120; output;
x=80; output;
*/

data letters;

letter=1;   /* I */
x=10; y=70; output;
x=20; output;
y=120; output;
x=10; output;

letter=2;  /* C */
x=40; y=70; output;
x=70; output;
y=80; output;
x=50; output;
y=110; output;
x=70; output;
y=120; output;
x=40; output;

letter=3;  /* A */
x=80; y=70; output;
x=90; output;
y=90; output;
x=100; output;
y=70; output;
x=110; output;
y=120; output;
x=80; output;
/* and the 'hole' in the top of the 'A' */
x=.; y=.; output;
x=90; y=100; output;
x=100; output;
y=110; output;
x=90; output;

letter=4;  /* N */
x=120; y=70; output;
x=130; output;
y=100; output;
x=150; y=80; output;
y=70; ouptut;
x=160; output;
y=120; output;
x=150; output;
y=100; output;
x=130; y=120; output;
x=120; output;

letter=5;  /* T */
x=180; y=70; output;
x=190; output;
y=110; output;
x=200; output;
y=120; output;
x=170; output;
y=110; output;
x=180; output;

letter=6;  /* S */
x=10; y=10; output;
x=40; output;
y=30; output;
x=20; y=50; output;
x=40; output;
y=60; output;
x=10; output;
y=40; output;
x=30; y=20; output;
x=10; output;

letter=7;  /* L */
x=50; y=10; output;
x=80; output;
y=20; output;
x=60; output;
y=60; output;
x=50; output;

letter=8;  /* E */
x=90; y=10; output;
x=120; output;
y=20; output;
x=100; output;
y=30; output;
x=120; output;
y=40; output;
x=100; output;
y=50; output;
x=120; output;
y=60; output;
x=90; output;

letter=9;  /* E */
x=130; y=10; output;
x=160; output;
y=20; output;
x=140; output;
y=30; output;
x=160; output;
y=40; output;
x=140; output;
y=50; output;
x=160; output;
y=60; output;
x=130; output;

letter=10;  /* P */
x=170; y=10; output;
x=180; output;
y=30; output;
x=200; output;
y=60; output;
x=170; output;
/* and the 'hole' in the top of the 'P' */
x=.; y=.; output;
x=180; y=40; output;
x=190; output;
y=50; output;
x=180; output;

run;

/* This goes with pattern2, to "white out" the letters */
data letters_2; set letters;
value=2;
run;

/* This goes with pattern3, to do the left hatchmark pattern */
data letters_3; set letters;
letter=letter+1000;
value=3;
run;

/* Now put all 3 map data sets together */
data my_map;
set background letters_2 letters_3;
run;

goptions xpixels=800 ypixels=598;
goptions device=gif;
goptions noborder;

ODS LISTING CLOSE;
ODS HTML path=odsout body="&name..htm" (title="Hidden Message") style=minimal;

pattern1 c=blue v=m2n45;
pattern2 c=white v=msolid;
pattern3 c=blue v=m2n315;

title1 ls=2.0 h=20pt font="albany amt/bold" color=gray55
 "Can You Read The Hidden Message?";

proc gmap map=my_map data=my_map;
id letter;
choro value / discrete
 coutline=white nolegend
 des='' name="&name";
run;

quit;
ODS HTML CLOSE;
ODS LISTING;
</pre>

1 Comment
Thanks, Robert. As a guy who is often working with SAS graphics tools or other SAS software at times when almost everyone else in his time zone is sleeping, I relate to the hidden message. The image reminds me of Mr. Pitt's vision quest on Seinfeld. Only Elaine and Kramer were able to see it. Steven J Subichin and I were early SAS/GRAPH users who created white space "holes" in the US map to CLEARLY display annotation of little tables of data inside each state, which were filled with color to match a legend for the response level. Some annotation had to be located offshore in the Atlantic Ocean with an arrow back to the state, when the state was too small. I think that eventually SAS/GRAPH was made able to address this need, but with only a halo of white space around the text rather than a rectangle. In some states, I "clipped" the rectangle into a polygon to avoid crossing the state boundary. Those were pre-web days, and now, of course, one can deliver "soft" annotation via ALT text (the pop-up box exposed with mouse work). But we needed to create hardcopy maps, and for the online displays then in use there was no pop-up text feature. I've always enjoyed PROC GMAP, and coined the word "InfoGeographics" to describe what it can deliver. The SAS/GRAPH nomenclature for what we generated with PROC GMAP is CHOROPLETH maps, and the mapping profession calls them thematic maps.
Regards,
LeRoy Bessler