All Posts
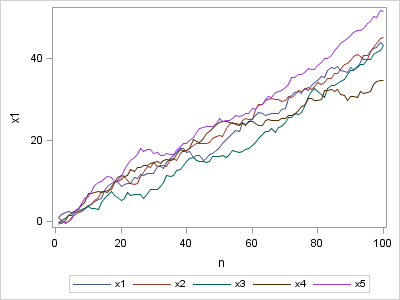

In my spare time, I enjoy browsing the StackOverflow discussion forum to see what questions people are asking about SAS, SAS/IML, and statistics. Last week, a statistics student asked for help with the following homework problem: I need to generate a one-dimensional random walk in which the step length and

Several times a year, I am contacted by a SAS account manager who tells me that a customer has asked whether it is possible to convert a MATLAB program to the SAS/IML language. Often the customer has an existing MATLAB program and wants to include the computation as part of

When I began my job at SAS in 1999 (I was only 14 years old at the time), one of my responsibilities was taking over the production of a listserv called NEWDOCNEWS. The listserv consisted of all the new titles from Books By Users (now SAS Press) and SAS Documentation
String comparisons in SAS software are case-sensitive. For example, the uppercase letter "F" and lowercase letter "f" are treated as unique characters. When these two letters represent the same condition (for example, a female patient), the strings need to be handled in a case-insensitive manner, and a SAS programmer might
Do you have many points in your scatter plots that overlap each other? If so, your graph exhibits overplotting. Overplotting occurs when many points have similar coordinates. For example, the following scatter plot (which is produced by using the ODS statistical graphics procedure, SGPLOT) displays 12,000 points, many of which


The ODS Graphics Designer allows you to design and build your own statistical graphs in SAS, without having to learn how to program in the new graph template language (GTL). The ODS Graphics Designer is a rich user interface that allows you to design these graphs based upon your own
I don't use the SAS macro language very often. Because the SAS/IML language has statements for looping and evaluating expressions, I rarely write a macro function as part of a SAS/IML programs. Oh, sure, I use the %LET statement to define global constants, but I seldom use the %DO and


I feel the experience of participating at SAS Global Forum year after year is like relishing a warm brownie! It’s the same treat but a unique experience every time. Subtle changes in the ingredients can lead to a unique and enhanced flavor. The team behind the scenes works hard to
If you haven't signed up for SAS Global Forum 2011 in Las Vegas, you'd better get moving: February 28 is the last day for early registration and the discounted hotel prices. You should also sign up for the pre-conference statistical tutorials, which are filling up fast! I was tempted to
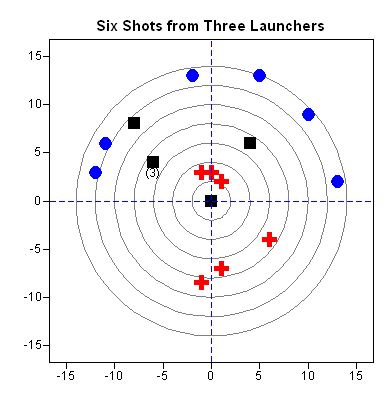
I was inspired by Chris Hemedinger's blog posts about his daughter's science fair project. Explaining statistics to a pre-teenager can be a humbling experience. My 11-year-old son likes science. He recently set about trying to measure which of three projectile launchers is the most accurate. I think he wanted to

I’m sure you will all agree that a programmer’s favorite task is to maximize efficiency thus enhancing performance. Dear reader, in this blog post I’ll share my best programming practices so that you can benefit from what I typically show my students in class. At the end I’d like to
I don't know much about the SQL procedure, but I know that it is powerful. According to the SAS documentation for the SQL procedure, "PROC SQL can perform some of the operations that are provided by the DATA step and the PRINT, SORT, and SUMMARY procedures." Recently, a fellow blogger,

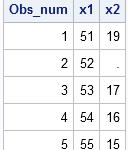
If you are a statistical programmer, sooner or later you have to compute a confidence interval. In the SAS/IML language, some beginning programmers struggle with forming a confidence interval. I don't mean that they struggle with the statistics (they know how to compute the relevant quantities), I mean that they
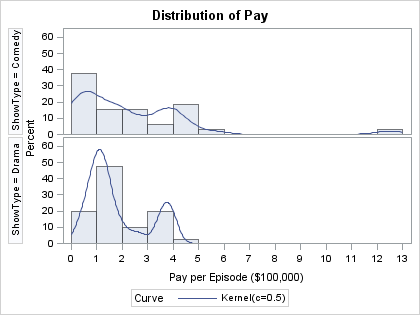
The Flowing Data blog posted some data about how much TV actors get paid per episode. About a dozen folks have created various visualizations of the data (see the comments in the Flowing Data blog), several of them very glitzy and fancy. One variable in the data is a categorical

I've known several people who were raised during the Great Depression, and I've observed that they are very mindful of waste. My wife's grandmother used to save plastic bags, twist ties, and relatively clean aluminum foil for potential reuse in the household -- because such materials were once scarce. The