All Posts

The parable of beer and diapers is often related when teaching data mining techniques. Whether fact or fiction, a Heat Map is useful to view the claimed associations. A co-worker recently enquired about possible ways to display associations or dependency between variables. One option is to show the dependency as a node


I have a love-hate relationship with spreadsheet data. I am interested in finding data to analyze, and if it arrives in the form of a spreadsheet, I'll take it. And I like to deliver results and reports, but often my constituents ask for it as a spreadsheet that they can
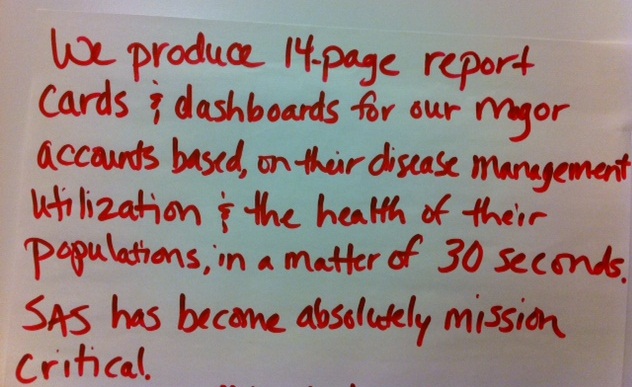

Big data is one of the hottest topics in business. When you hear those words - BIG Data - you almost surely think of: HUGE financial services firms scoring terabytes of historical and current risk data GLOBAL telecommunications companies mining petabytes of structured and unstructured data INTERNATIONAL retailers repricing hundreds of thousands of products across
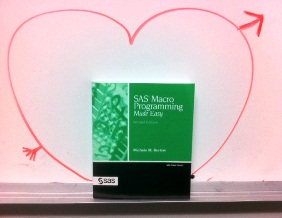

As SAS user Marje Fecht said "We all want a 'SAS programming assistant' to help us complete our jobs more quickly." Fecht, Senior Partner at Prowerk Consulting, then went on to say "In her book SAS Macro Programming Made Easy, Second Edition, Michele Burlew encourages us to take advantage of the SAS

The American Association of State Highway Transportation Officials recently released a top 10 list of transportation issues that will be “talked, written or tweeted and legislated about” in 2012. As expected, funding constraints and Congressional action on reauthorization appear on the list but the group also notes that natural disaster


Unlike prior versions of SAS OLAP technology, 9.2 provides more options for maintaining and refreshing OLAP cubes. With this comes some discussion about what each one does alone, and how pairing these techniques really provides SAS OLAP Server Administrators and cube developers a cornucopia of OLAP options. PROC OLAPOPERATE Remember
Here is the second installment of sample graphs from the SG Procedures book - The Adverse Event Timeline. This is a graph commonly used in patient profiles for clinical trials where we track the progress of a patient through a hospitalization event, tracking the dates and severity of the adverse events. The
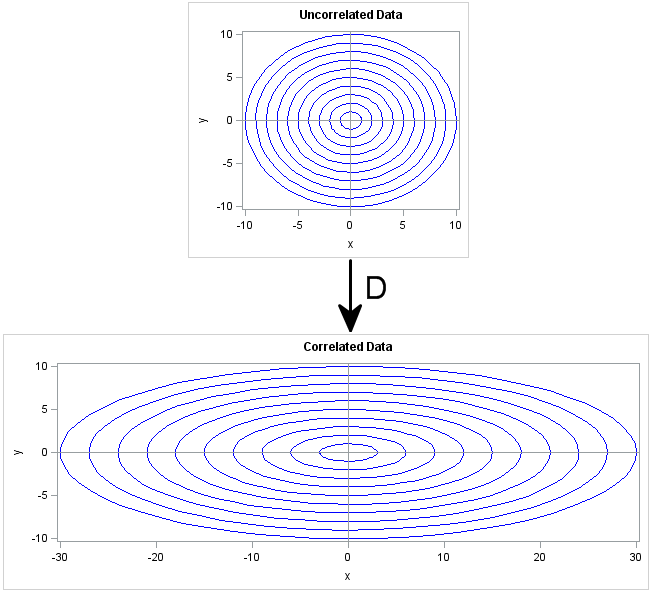

A variance-covariance matrix expresses linear relationships between variables. Given the covariances between variables, did you know that you can write down an invertible linear transformation that "uncorrelates" the variables? Conversely, you can transform a set of uncorrelated variables into variables with given covariances. The transformation that works this magic is
Recently a user posted a question on the SAS/GRAPH and ODS Graphics Communities page on how to plot the normal density curves for two classification levels in the same graph. We have often seen examples of a distribution plot of one variable using a histogram with normal and kernel density curves. Here is a simple example: Code Snippet:
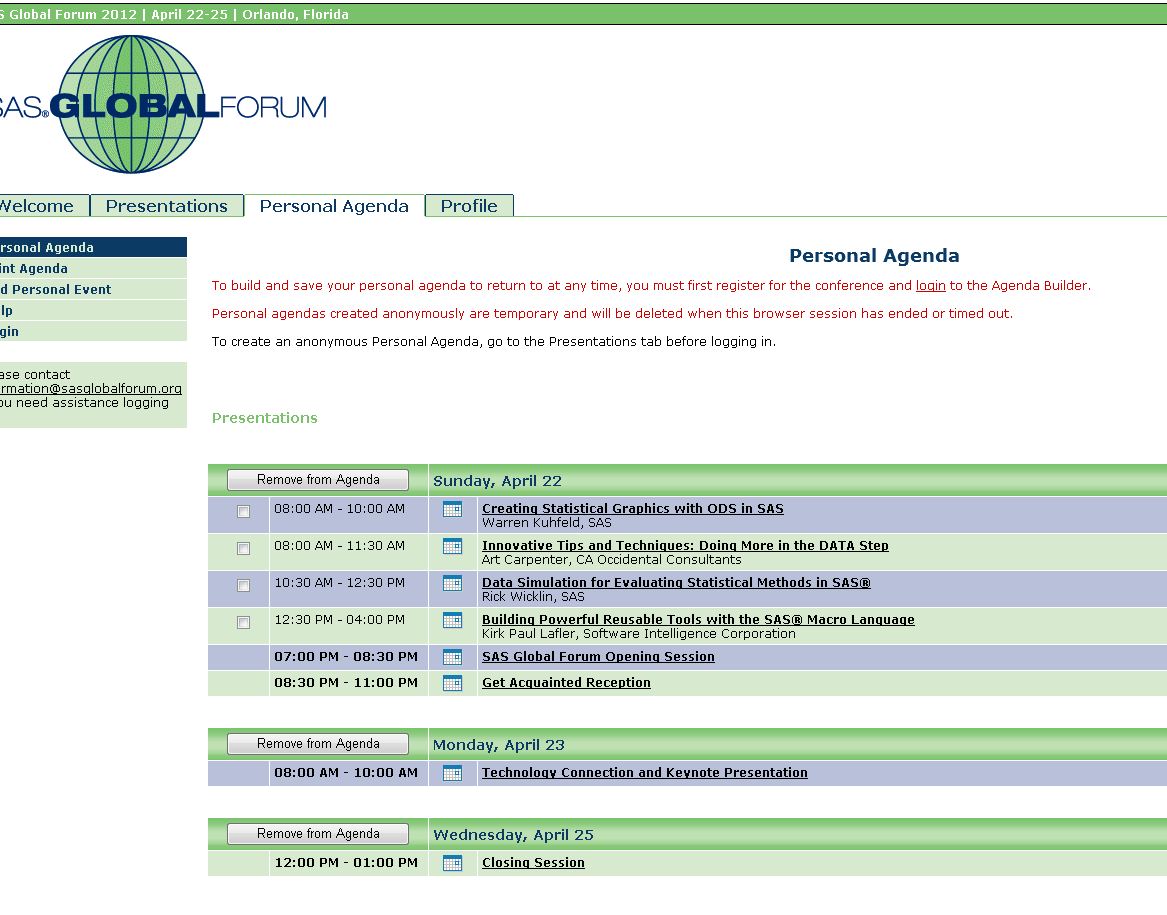

Sara started it, and I like the idea - the Unofficial Official Guide to SAS Global Forum. My contribution to this unofficial guide is “The Agenda Builder and why it matters to me." In case you're wondering, I use it to:


My colleague, Steve Serrao, just published a blog post on the proliferation of varied law enforcement approaches and their related phraseologies. After reading, I concur – hence, this blog’s title. I am not a huge fan of the term “predictive policing”. While others may love it and live it, and

We call it the "metadata profile", but really it's like a telephone number that connects you to your SAS environment. Just as a telephone number has component parts (country code, area code, exchange), the metadata profile contains information that allow you to "dial in" to your SAS servers. This information
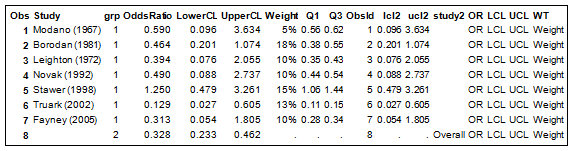
In December of last year, the book "Statistical Graphics Procedures by Example" co-authored by Dan Heath and I was published. On the back cover, it proclaims "Free Code on the Web". Now, who can resist such an offer? Since most of the examples in the book have very short syntax,
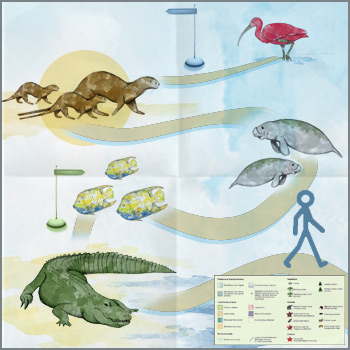

Everyone is looking for a bargain, especially those traveling with their families to Orlando for SAS Global Forum. Orlando is the land of theme parks and attractions, many with hefty ticket prices. Since I am heading to Orlando in April myself, I have been doing quite a lot of research.

Recently, I had a discussion with a user concerning the volume of imagemap data generated for an interactive, web-based visual contain a large number of graphs. The large amount of imagemap data was causing problems with the current version of their web browser. The graphs consisted of either bar charts