All Posts


Are you a SAS professional working in the insurance or financial services industry? Are you looking for a place where you can talk with others who work in the those industries? Would you like to get together and network, face-to-face, or share ideas and best practices for using SAS? There is now a SAS Users Group just for you;

Often it is useful to view multiple responses by a common independent variable all in the same plot. SGPLOT procedure and GTL support the ability to view two responses, one each on the Y and Y2 axes by one independent variable (X) in one graph. Yes, you can also have X

In the Star Wars movie, Obi-wan could just wave his hand, mutter a few words, and the stormtroopers would "move along". How the power of the Force makes ridding yourself of problematic characters so much easier! I recently was invited to become an alternate instructor for Ron Cody’s SAS Business
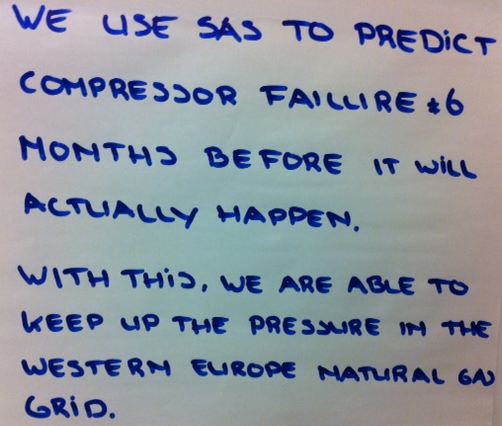
It's Friday the 13. That can conjure up all kinds of scary thoughts, or you might consider it a lucky day. Which is it for you? This SAS user doesn't rely on luck or chance with his or her important projects. SAS is used to predict failures and outages!


A’s in the front, Z’s in the back. How many of us grew up sitting in alphabetical order next to the same few classmates throughout school? While this is a quick and efficient way to learn student names, which is no easy task, it is not the most effective way
Recently a user posted a question on the SAS/GRAPH and ODS Graphics Forum about drawing a plot with custom confidence intervals . The user has a simple data set with category, response (mean) and custom lower and upper confidence intervals. The data looks like this: Robert Allison provided the code (proc gplot +

Before there was CNN or FOX News, people used to get their news from SAS. At least, that's how I imagine that people kept themselves informed. What else can explain the existence of the NEWS= system option, which helps SAS admins to surface the must-know information to the SAS community?
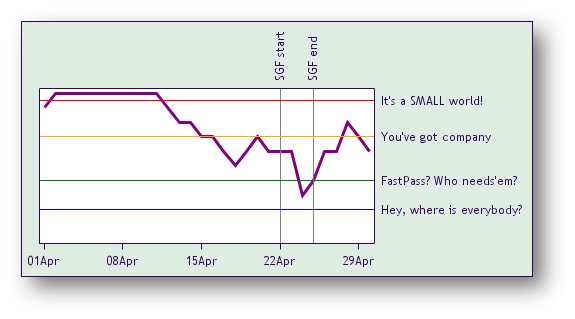
I'm about to give you the single-most valuable piece of advice for getting the most out of your experience at SAS Global Forum 2012.


Dear Miss SAS Answers, In PROC REPORT can I use one calculated (computed) variable in the calculation of another computed variable? In the example below, I’m trying to use the value of the Bonus column to calculate the Total column: compute Bonus; Bonus =sal.sum*0.05; endcomp; compute Total; total=sum(sal.sum, Bonus.sum); endcomp;


During one week in December, two separate transportation agencies within the federal government made two major announcements. First, the National Highway Traffic Safety Administration (NHTSA) – the government agency responsible for guiding traffic safety initiatives on the nation’s highways announced that crash fatalities had declined to record low rates. Just


For 25 years, winners of sporting events, singing competitions and beauty pageants have been spouting the same response when asked, “What’s next?” Their simple answer - “I’m going to Disney World!” - makes us all jealous.
A recent post on the SAS website shows the SAS Annual Revenue History. It would be interesting to see how we could create such a graph using SG procedures, and how we could add more information and interest in the presentation. So, I started with the basic informaiton on the annual revenues provided,
If you live in the US, do you remember the Dunkin Donuts commercial from about 30 years ago. It opens with a devoted donut maker climbing out of bed, saying "It's time to make the donuts." (Donut makers have to get up early so that you and I can have
Following up on the theme of graphs commonly used in many applications, here is another one that displays a horizontal bar chart with multiple data columns aligned with the bars. Recently at WUSS, a user stopped by asking how to create just such a graph. While this user wanted something more complex

In the immortal words of Britney Spears: Oops! I did it again. At least, I'm afraid that I did. I think I might have helped a SAS student with a homework assignment, or perhaps provided an answer in preparation for a SAS certification exam. Or maybe it was a legitimate