All Posts

I follow quite a few SAS users who blog. One of my favorites - because she shares my quirky wit and hatred for shopping - is Dr. AnnMaria De Mars, author of AnnMaria's blog. She has a way of telling stories that leaves me in stitches. I was reading about how AnnMaria

This past Monday, Tricia and I released our 2nd book this year. "The 50 Keys to Learning SAS Stored Processes" provides a step-by-step approach to transitioning from SAS code into user driven (prompted) stored processes. Trimming down all the things you can do with SAS Stored Processes is next to


I blog about a lot of topics, but the following five categories represent some of my favorite subjects. Judging by the number of readers and comments, these articles have struck a chord with SAS users. If you haven't read them, check them out. (If you HAVE read them, some are


Watch live streaming video from sasglobalforum2012 at livestream.com Anna Brown speaks with Chris Hemedinger, SAS Technical Architect and author of "SAS for Dummies," on what he'll be doing at SAS Global Forum 2012. Learn more about his Closing Session keynote "You Don't Have to Go Home ... But You Can't


The leading cause of death for Americans between 5 and 34 isn’t what most would expect. It’s not disease or acute illness. It’s traffic crashes. The good news is that the number of highway deaths has steadily decreased the last few years, yet crashes still cause more than 30,000 fatalities and

By now, I’m sure you have created your personal agenda for SAS Global Forum – so guess I will see you on Tuesday morning (9:30 am) in the Southern Hemisphere V area for the Get Your “Fast Pass” to Building Business Intelligence with SAS and Google Analytics presentation. Angela Hall

If you have seen the movie Office Space or been to a TGI Fridays then you have heard about having FLAIR! We can assume that the more flair a person has the more fun they are having. In this case of SAS Global Forum, the more flair you have, the

SAS Global Forum 2012 at Orlando, Florida is just round the corner and we are excited to see so many presentations offered by users on SG procedures and GTL. We'll add a few more on new SAS 9.3 features of SG procedures and GTL. These include cluster groups for discrete and interval axes, cluster
Amidst all of the SAS users and SAS professionals there will also be others who are very excited to be at the conference - analytics and technology bloggers (scads of them!). One of those bloggers, with whom I will finally get to make a face-to-face connection at SAS Global Forum,

Hi, I'm Andrea Wainwright-Zimmerman. I'm doing two papers at SAS Global Forum 2012: one in Reporting and Information Visualization and one in Coder's Corner. In Coder's Corner, I've got a simple trick using a DATA Step and a PROC SORT to achieve the same thing as a PROC SORT NODUPKEY, but I let

An event is fast approaching that is the highlight of the year for many members of the SAS community. I am, of course, referring to SAS Global Forum 2012, which this year will be hosted in the Walt Disney World Swan and Dolphin Resort in Orlando, Florida. I am particularly

For me, this will be a SAS Global Forum of many "firsts". My first Closing Session. My first time attending as a staffer outside of SAS R&D (well, except for the chilly SUGI 21 in Chicago). And my first chance to host the SAS Tech Talk sessions, which will be
Inside SAS Global Forum host Anna Brown gets the inside scoop on all the new activities at SAS Global Forum 2012.

Hi. I'm Amy Peters, Product Manager at SAS. I've scheduled a meetup at this year's SAS Global Forum to talk with you about WebDMS (in Northern Hemisphere E-2 at the Dolphin). It's under development - the basic version is due to be released this summer on SAS® 9.3 for use by SAS OnDemand for Academics for
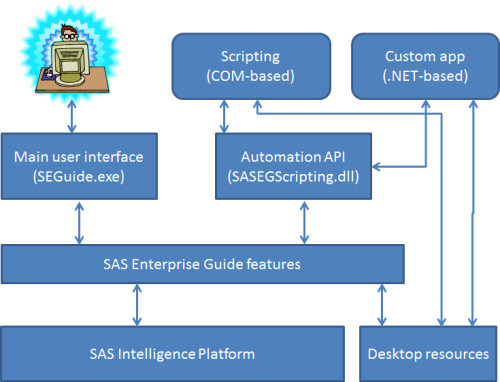
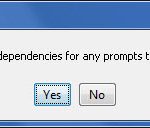
Have you ever selected File->Schedule Project or Schedule->Process Flow in SAS Enterprise Guide? Are you curious about what magic these actions will trigger? Here's what happens: SAS Enterprise Guide creates a VBScript program that contains the instructions to start SAS Enterprise Guide, load your project, run your project or flow,