All Posts
Bill Franks’s new book, Taming the Big Data Tidal Wave: Finding Opportunities in Huge Data Streams with Advanced Analytics, has just released. This book shows how big data is changing the world of analytics; what people, processes, technologies, and mindsets are necessary to succeed in analytics in this new era;


Nancy Rausch, from SAS R&D, is driving a short demonstration of how to access Hadoop via SAS Data Integration Studio. Take a look. You're probably going to want to take a look at this paper, too: What's new in SAS Data Management?

Today, everyone from chief marketing officers to the senior vice president of sales to bloggers want to know more about the behavior of the readers and consumers who are clicking on Web pages, Internet articles and blogs. Clickstream data is a valuable source of information about the products, services and information that resonates with


How can you go home on time? Take a quick tour with these 5 tips that I was able to summarize for my students in the SAS SQL 1: Essentials class yesterday. Since they found it handy and asked if it could become a blog post, I thought I’d share

On Friday before the conference, I presented a 1 day "developer led" seminar on SG Procedures and GTL, along with a discussion of new features for SAS 9.3. The experience was very gratifying as all users were now using SAS 9.2, and some were using SAS 9.3. We had a lively
sasglobalforum2012 on livestream.com. Broadcast Live Free New this year to SAS Global Forum are Tech Talks. In this session, Chris Hemedinger is chatting with: High-Performance Data Mining Jared Dean, Director of SAS Enterprise Miner R&D Text Analytics and Sentiment Analysis: Case study of AllAnalytics.com Jim Cox, Senior Manager of


Many companies are challenged not only with analyzing big data, but with storing and accessing the data. In some cases, organizations can choose an open source storage solution to reduce costs. One popular open source solution is Hadoop. Anna Brown is talking with Paul Kent, Vice President Big Data at SAS,
The Technology Connection is one of the most anticipated and most talked about events at SAS Global Forum. This year, that will surely be the case. The skits truly showed the real world practicality and value of what these new products bring to the table. Whether you were at
sasglobalforum2012 on livestream.com. Broadcast Live Free Opening Session for SAS Global Forum 2012 had some extraordinary announcements and entertainment - among them SAS CEO Jim Goodnight sat down at his computer to demo the newest high-performance analytics product in front of a packed house. I knew you'd want to take


“It is what it is” is a popular phrase among 25-to 35-year-olds. Some use this catchall phrase to express acceptance when things can't be changed - things are beyond their control and they are OK with that. It can hold a negative connotation, too. It could be synonymous with “We’ve

For those of you who want to see and try e-Learning, please come visit me at the e-Learning booth at SAS Global Forum in Orlando. Follow me on The SAS Training Post, and I will tell you more about what the future holds for e-learning (think mobile and iPad!). To see

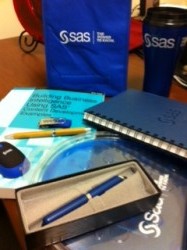
Calling all budding photographers! We want to see how you experience SAS' biggest user conference of the year - SAS Global Forum. What better way to share your favorite #SASGF12 moments than through pictures? This year, we are trying something new and will be using the popular photo-sharing app Instagram
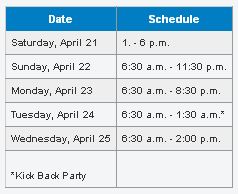
You know this always happens. You try to plan for everything. You make lists and check them off and still, you forget something. Well, SAS Gloal Forum is a big event and you are probably thinking of a thousand things at once. Here's some last minute information to help you
Recently, an interesting question was posed on the previous article on this blog by a reader. Can we use the new DiscreteAttrMap feature to create just a legend with specific entries, with no graph. The question was intriguing enough that I did not wait to ask - "Why?". I just got
What do you mean you've never heard of a Tweet Up/Geek Out? Well, I only made part of it up. A Tweetup is an event where people who network together on Twitter get together offline to chat and get to know one another better. My definition of a Geek Out