All Posts


Do you feel the need to be flawless in your work to avoid being exposed as an “imposter”? Do you delay tasks because you fear not meeting your own or others’ expectations? When you succeed, do you attribute it to luck or external factors rather than your own abilities? If

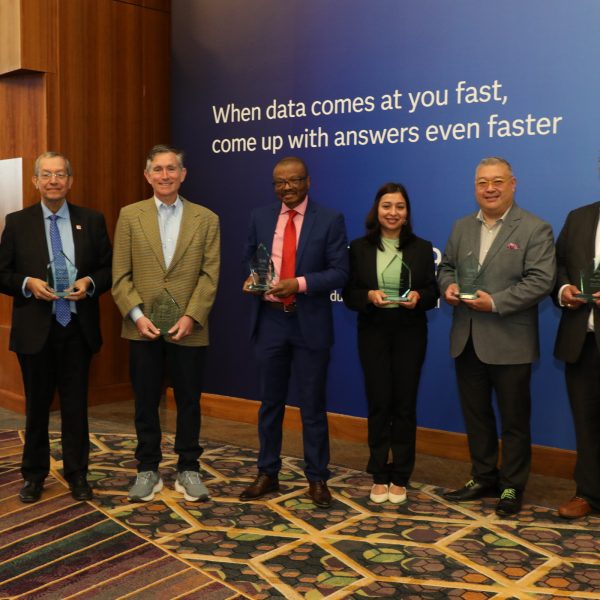
2024年5月31日(金)、SAS Institute Japanは、「保険業界向けインタラクティブセッション 新しい保険ビジネス創造に向けた事例と成功要因」 を六本木ヒルズ森タワー11階のSAS Institute Japan本社で開催した。 開会挨拶 保険業界においても顧客ニーズは多様化、高度化している。たとえば、生保ではウェルビーイングのような包括的な顧客ニーズを充足することが求められている。そして、顧客ニーズを充足するためのエコシステムが台頭し、保険商品がエコシステムに組み込まれ、顧客の生活の中でフリクションレスに保険や関連サービスが提供されるようになっている。今、保険会社はどのように新しい商品・サービスを開発し、マーケティングを実行すべきなのか。本イベントでは、保険業界で実際に多数のイノベーションやCX変革に関わっている有識者をゲストに迎え、今取り組むべき課題やその実際を議論していく(SAS Institute Japan カスタマアドバイザリ事業本部 原島 淳氏)。 セッション1:保険業界におけるビジネスアーキテクチャの転換 まず、福島 渉氏(デロイトトーマツコンサルティング 執行役員 保険インダストリリーダー)が「保険業界におけるビジネスアーキテクチャの転換」について話した。 「これまで世界の保険業界において、ランキング上位企業の顔触れは大きく変わってこなかった。100年以上の歴史を持つ保険会社がランキング上位を占めている。それは従来の保険会社はバリューチェーンの各機能を内製化しており、それぞれの知見や能力が競争優位性の源泉であり、また参入障壁になっていたからだ。大手企業は、潤沢な資本を背景とした価格形成力を持ち、販売網を張り巡らせ、そして高い引受・査定能力により収益を維持してきた。 しかし、今日ではバリューチェーン各機能の分立と共有化が進んだことで、この構造が崩れ始めている。保険会社のビジネスモデルは多様化しており、また水平横断的機能提供を狙うプラットフォーマーが出現している。各保険会社は自らの強みを活かしながら、フィナンシャル&ヘルスマネジメント型、経済活動のあらゆるリスクをカバーするフルスペック型、ドメインフォーカス型、もしくはプダクトファクトリー型といったビジネスモデルを選択していくことになると予測する。また、機能特化/集約型プラットフォーマーとして、データアナリティクス、カスタマーエンゲージメント、キャピタル&インベストマネジメント、ITテクノロジーのプラットフォーマーが出現してくるだろう。たとえば、資産運用プラットフォームBlackRock、”Technology as a Service”のOneConnectといった企業はそれに当たる。保険会社はこういったプラットフォーマーを活用することも重要だ。 このような潮流を受けて、保険業界のビジネスアーキテクチャは変化している。これまでは、単一の商品を効率的に販売する”代理店モデル”が主流だった。しかし、これからは商品・サービスとチャネルをターゲット顧客に応じて最適な形で組み立てていくことが重要だろう。前述のような機能プラットフォーマーが提供する”モジュール化”された機能を自社の商品・サービスやチャネルと組み合わせることで新しいビジネスモデルを定義し、多数の顧客セグメントに効率よく価値提供することも可能だ。たとえば、よく知られるエンビデッド保険や、シンガポールIncomeのSNACKの革新的なサービスもその一例だ。 今日の保険業界ではスピーディーなイノベーションが強く求められている。イノベーションを加速させるには、モジュール化された機能を組み合わせることで、商品・サービスをスピーディーにプロデュースする能力が重要と言える。これからの保険会社に求められるのは、ブランド価値とビジネスケースの仮説構築力と、それをもとに商品・サービスをアジャイルで構築できる新しいテクノロジー基盤、そこで仮説検証を高速で廻せる業務プロセスである。今日の保険会社には、商品・サービス開発、マーケティング、テクノロジー、そして全体のガバナンスの各領域で、”モジュール”を活用したスピーディーな競争優位性の創造が求められている。」 セッション2:三井住友海上におけるCXマーケティングとデータ活用の取り組みについて では、保険会社では実際にどのように商品・サービスを開発し、マーケティングを行っているのだろうか。続いて、佐藤 祐規氏(三井住友海上 CXマーケティング戦略部 データマーケティングチーム長)が「三井住友海上におけるCXマーケティングとデータ活用の取り組みについて」と題して、実際の取組みを紹介した。 「言うまでも無く、保険業界を取り巻く環境は大きく変化した。お客さまが自ら必要な情報を選択する時代では、事故補償時だけの関係性から脱却しなければならない。CXマーケティング戦略部では、お客様ロイヤルティ大手損保No.1を目指している。このためには、顧客接点を増強すること、そして、データ分析やリサーチを通してお客様の解像度を高め、お客さまごとのコミュニケーションを実施することで、新規獲得手法を高度化し、またお客さまの期待を超える体験価値を提供することが重要だ。そして、そのためにはデータ分析やデータ活用が欠かせない。 当社ではマーケティング領域のデータ活用を強化しているが、いくつかの取組事例を紹介する。まず、ドラレコ付き自動車保険のクリエイティブ開発の事例だ。従来、クリエイティブ開発は商品所管部門が担当しており、モノの視点(機能的価値)からの価値訴求が多かった。しかし、実際にお客さまへの訴求を行っている代理店への調査を行ってみると、お客さまは加入後の体験とそれによる安心に価値を感じていることがわかった。そういった体験価値の視点からプロトタイプを作成し、ターゲット層にアンケート調査を行うことでブラッシュアップを行い、より評価の高いクリエイティブを作成することができた。 この事例のように、消費者調査を行なうことで顧客のニーズや求められる価値を理解した上で、商品・サービス開発を進めている。お客さまに選んでいただくためには、良い商品を開発するだけでなく、当社の認知度や好感度、さらに契約体験や事故体験も重要な要因となる。それぞれの体験や認知が契約にどの程度寄与するのかも分析を行っている。 こういった分析を通してマーケティングミックスを最適化するために、弊社ではCDP(Customer Data Platform)を構築し、お客様起点で属性、契約、行動、調査、事故の情報を統合、活用している。この情報は代理店にも還元していて、代理店向け営業支援システムにNBA(Next Best Action)情報を配信している。 今後の方向性として、保険会社はプロダクト中心の発想から抜け出し、カスタマージャーニーにおける価値を中心に考える必要がある。顧客との接触頻度を拡大すべきだが、無意味な拡大は逆効果で、適度な距離感を持って、有用なコミュニケーションを行っていくことが重要だ。そのためにはお客さまの文脈を押さえた(”ジョブ理論”にもとづく)コミュニケーションが欠かせない。現在、ChatGPTを活用しながら、ジョブ理論にもとづくクリエイティブ開発を進めているが、こういった施策を通してCX向上を目指したい。保険会社の商品・サービスは今後拡大していくだろうが、差別化の最大のポイントはCXだと考えている。」 セッション3:保険イノベーションをサポートする新しいSASテクノロジと事例 こういった保険業界のイノベーションやCX高度化に求められるテクノロジーとは何か。原島 淳氏(SAS Institute Japan カスタマアドバイザリ事業本部)が「保険イノベーションをサポートする新しいSAS」と題して、SASが提供するテクノロジーと海外でのその活用事例を話した。 「保険会社は今、新しい商品・サービスとそのマーケティングモデルをスピーディーに創造していくことが求められている。競争力の源泉としてデータとAIを活用し、また新しいマーケットプレイスやテクノロジー企業が提供する”モジュール”との連携も重要だ。 SASはデータから価値実現のプロセスをEnd-to-Endでサポートし、アジャイルにも対応している。また、あらゆるシステム/モジュールとリアルタイムで統合可能なオープン性を持つ。SASを活用することで、データ・AIを活用した判断をカスタマージャーニーに組み込み、顧客体験を最適化できる。たとえば、外部ウェブサイトの顧客行動をリアルタイムで捕捉・分析し、最適な保険・サービスを最適な保険料で提案。申込があれば本人確認を行い、自動引受査定を行い、スピーディーに契約のご案内を行う、といった形で、業務横断のデータ・AI活用が可能だ 保険業界においてもSASを活用した事例は拡大している。その中から、(1)新しい商品・サービスをスピーディーに創造している事例、(2)優れたCXを提供する顧客接点を構築している事例、(3)業務横断の高度なデータ・AI活用を実施している事例を紹介したい。 まず、(1)海外ダイレクト保険プラットフォーマーでは、多数の外部パートナーに対し、APIを通して豊富な商品とSASで開発されたカスタマーエンゲージメントプラットフォームを”モジュール”として提供する。このプラットフォームはスケーラブルで、かつスピーディーに拡張できる点が特徴であり、多数の外部パートナー向けのエンベデッドの保険の提供や、金融・小売といった多数の販売パートナーとの提携によるマーケティングモデルの展開をサポートしている。次に、(2)カナダSun Lifeでは、デジタルアドバイザ”Ella”がアマゾンエコーなどのインターフェースを通して顧客のライフスタイルをサポートしながら、各種データにもとづいて健康や資産運用のための様々なナッジを提供している。(3)海外保険会社の中小企業向け保険のアンダーライティングでは、引受リスクだけでなく、保険+予防予後サービスを含むトータルの顧客LTVを加味して最適な提案(NBO=Next


In financial services, the onboarding journey takes on heightened significance. It’s not just about welcoming new customers—it’s about safeguarding their information, validating identity, mitigating risk, ensuring regulatory compliance, and making a great first impression. To achieve these goals, modernizing the decisioning process is crucial. In fact, decisioning lies at the


One of the most exciting features of SAS Viya Workbench is that the code editor includes a generative AI component called SAS Viya Copilot. This feature was announced and demonstrated at SAS Innovate 2024. With the Copilot, you can specify a text prompt that generates SAS code. For example, you


Gran demanda laboral para las profesiones en esta área con un requisito de 700,000 nuevos profesionales para cubrir las necesidades del mercado. Herramientas de capacitación y actualización gratuitas en SAS La Ciencia de Datos se convierte en una de las carreras más atractivas y demandadas, los profesionales y estudiantes interesados

Good educators are more than a source of knowledge; they inspire, innovate and continuously adapt to provide their students with the best learning experiences. They embrace new technologies, foster critical thinking and prepare students for future challenges. Recognizing their importance, SAS recently honored educators at SAS Innovate 2024. This year’s


공공 고객 세미나 통해 공중보건과 공공사회서비스 개선을 위한 해법 제시 SAS코리아는 지난 5월 23일과 24일 양일간 공공 부문 고객들을 대상으로 ‘공중보건 전문가를 위한 SAS Public Health 세미나’와 ‘공공사회서비스 전문가를 위한 SAS Social Services 세미나’를 JW메리어트 호텔에서 개최했습니다. [사진1] 공중보건 전문가를 위한 SAS Public Health 세미나 장면 소외 계층 없이 전


AI governance is an all-encompassing strategy that establishes oversight, ensures compliance and develops consistent operations and infrastructure within an organization. It also fosters a human-centric culture. This strategy includes specific governance domains such as data governance and model governance, necessary for a unified AI approach. Why AI governance matters The
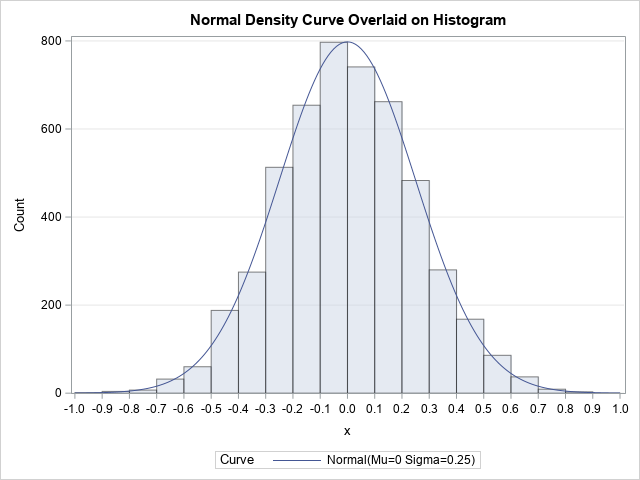
This article discusses how to scale a probability density curve so that it fits appropriately on a histogram, as shown in the graph to the right. By definition, a probability density curve is scaled so that the area under the curve equals 1. However, a histogram might show counts or


Learn how to fit a random forest and use your model to score new data. In Part 6 and Part 7 of this series, we fit a logistic regression and decision tree to the Home Equity data we saved in Part 4. In this post we will fit a Random


“Generative AI is essentially just a subcategory of AI; it’s not that new algorithms have been invented.” Marinela Profi, AI Product Strategy Lead at SAS, says it up front and directly in her most recent podcast interview. “It takes a variety of data points, code, images and then, based on


Every June I try to write a blog post in honor of PRIDE month and in celebration of my wonderful LGBTQ+ colleagues, friends, and family members. This is for all the other parents and allies out there. It is about showing up. It is about aligning your words with your


In a previous blog post, we discussed how generative AI (GenAI) is experiencing unprecedented popularity, with organizations across various industries eager to unlock its immense potential. We also highlighted potential use cases organizations must identify to unlock GenAI's full potential with credit customer journeys. These can include using chatbots for
SAS Hackathon Boot Camp が SAS Innovate Tokyo に登場 2024年7月18日からSAS Innovate Tokyoが東京丸の内で開催されます。参加される皆さんは、SAS Hackathon Boot Campにもぜひご参加ください。参加は無料です。この Boot Campは、提供されるダイナミックなAI環境の中で、"経験豊富な問題解決者" である皆さんが一丸となって課題に取り組むことができるプログラムとなっています。多様な専門的バッグラウンドを持つ皆さんのご参加をお待ちしてます。このプログラムは、与えられた課題に取り組む中で、融資業務の評価を実際に体験することができるものとなっています。金融業界でのバックグラウンドの有無にかかわらず参加いただけます。 プログラム Boot Campのプログラムは、信用審査モデルにおいて、特に性別、年齢、人種、場所、その他の潜在的な要因に関連する、"隠れたバイアスの蔓延"という問題に対して取り組む内容となっています。参加者には、そのようなバイアスが存在する可能性のある現実世界のシナリオをシミュレートするデータセットが提供されます。ゴールは、そのような既存のバイアスを持ち続けず、これ以上増やさないためにも、フェアな信用審査モデルを新たに作成することにあります。利害関係者とのコミュニケーションを可能にするための、データセット内の潜在的な問題の評価を支援するダッシュボードの作成ももう一つのゴールです。 オプション 参加者はローコード、ノーコード開発のどちらかを選択することができます。また、プログラムの課題を通して、SAS Viya 上での、AI、アナリティクス、オープンソースツールの組み合わせを体験していただけます。 ユースケースオプション: 信用審査モデリングデータのバイアスの検出 (ローコード) 一度に 1 つのダッシュボードで信頼性の確認ができる: 倫理的なデータ可視化の課題 (ノーコード) 必要な準備 インターネット環境に接続可能なご自身のPCをご持参ください。 サポート SASから提供されるものは以下です。 Azure上で実行され、Intelによって高速化されたSAS CloudでのSAS Viyaへのアクセス 問題の説明とデータ SASのメンターによる課題取組み中のコーチング 会場でのWi-Fi チーム チームは2〜4人で編成されます。歓迎されるスキルは以下です。 公平性を判断するための批判的思考 データに存在するさまざまなタイプのバイアスに関する認識 データインサイトを解釈して伝達する能力 複雑なコンセプトを伝えるための強力なコミュニケーションスキル


Presentation skills are an often-overlooked tool in the data scientist's box, and there's nothing like a room full of police to drive home the message that not everyone is a data geek. Police officers have a more visceral job than data scientists. Formulae, algorithms and methodologies aren't relevant to their