All Posts


Yea! My paper was accepted at the SAS Global Forum 2013. There’s nothing better than getting an email from your section chair saying your paper has been accepted. Steve Overton was correct in his The Wait is Killing Me post. Angela Hall and I were invited to conduct a Hands
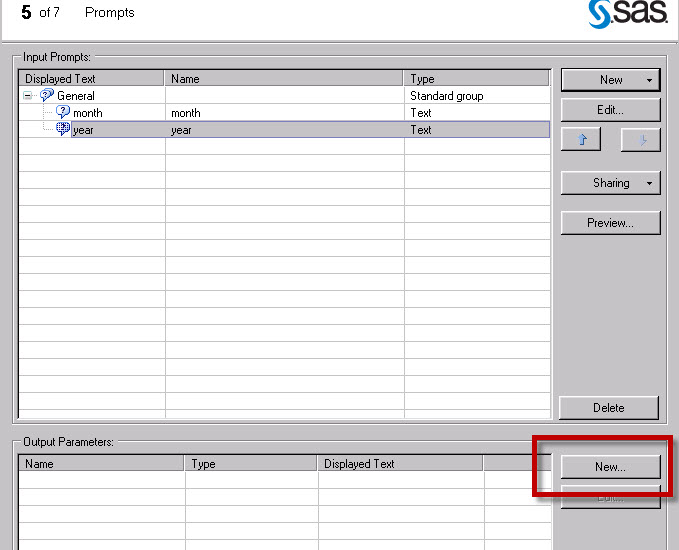

SAS Technical Support has a wonderful how-to guide for using one set of prompt values across multiple sections of a Web Report Studio report. This works great in 4.2, however there is one additional item that I discovered in a 4.3/9.3 install. With the addition of PROC STP and SAS
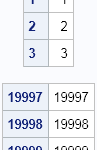

A SAS/IML user on a discussion forum was trying to read data into a SAS/IML matrix, but the data was so large that it would not fit into memory. (Recall that SAS/IML matrices are kept in RAM.) After a few questions, it turned out that the user was trying to


Big data seemed like all of the other marketing hype that we hear. But as the months have gone by, it seems clear that everyone is dealing with big data. You know, data coming in so fast that you can't adequately analyze it (at least not as efficiently and quickly
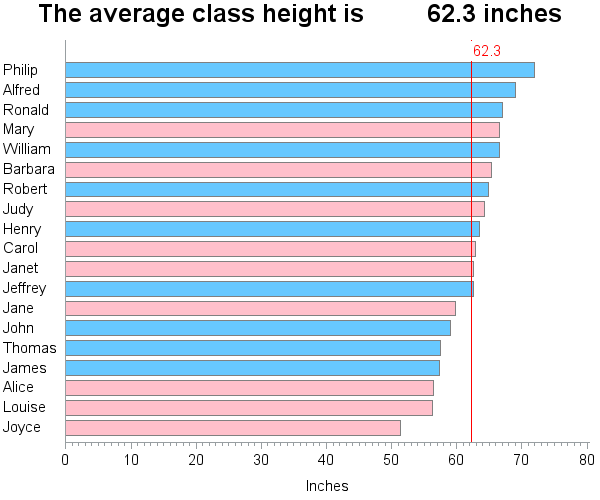

SAS macro variables are a great way to store a calculated value, so you can use it later in your code. They are not just limited to the data step -- you can also use macro variables in title statements, axis statements, etc. By default, the macro variable will be padded with


Happy belated New Year! For what it’s worth, no, I am not calling you a “dummy” or writing this just for Chris Hemedinger– just wanted to get your attention. This blog is actually an introduction to a series that I am kicking off this year entitled: "It's all about the data…"
A while ago I saw a blog post on how to simulate Bernoulli outcomes when the probability of generating a 1 (success) varies from observation to observation. I've done this often in SAS, both in the DATA step and in the SAS/IML language. For example, when simulating data that satisfied

Often we have the need to see the data by two different classifiers at the same time, as requested by a recent query on the SAS Communities page. In this example I have simulated a response over time for patients by study and treatment. We want to create series plots
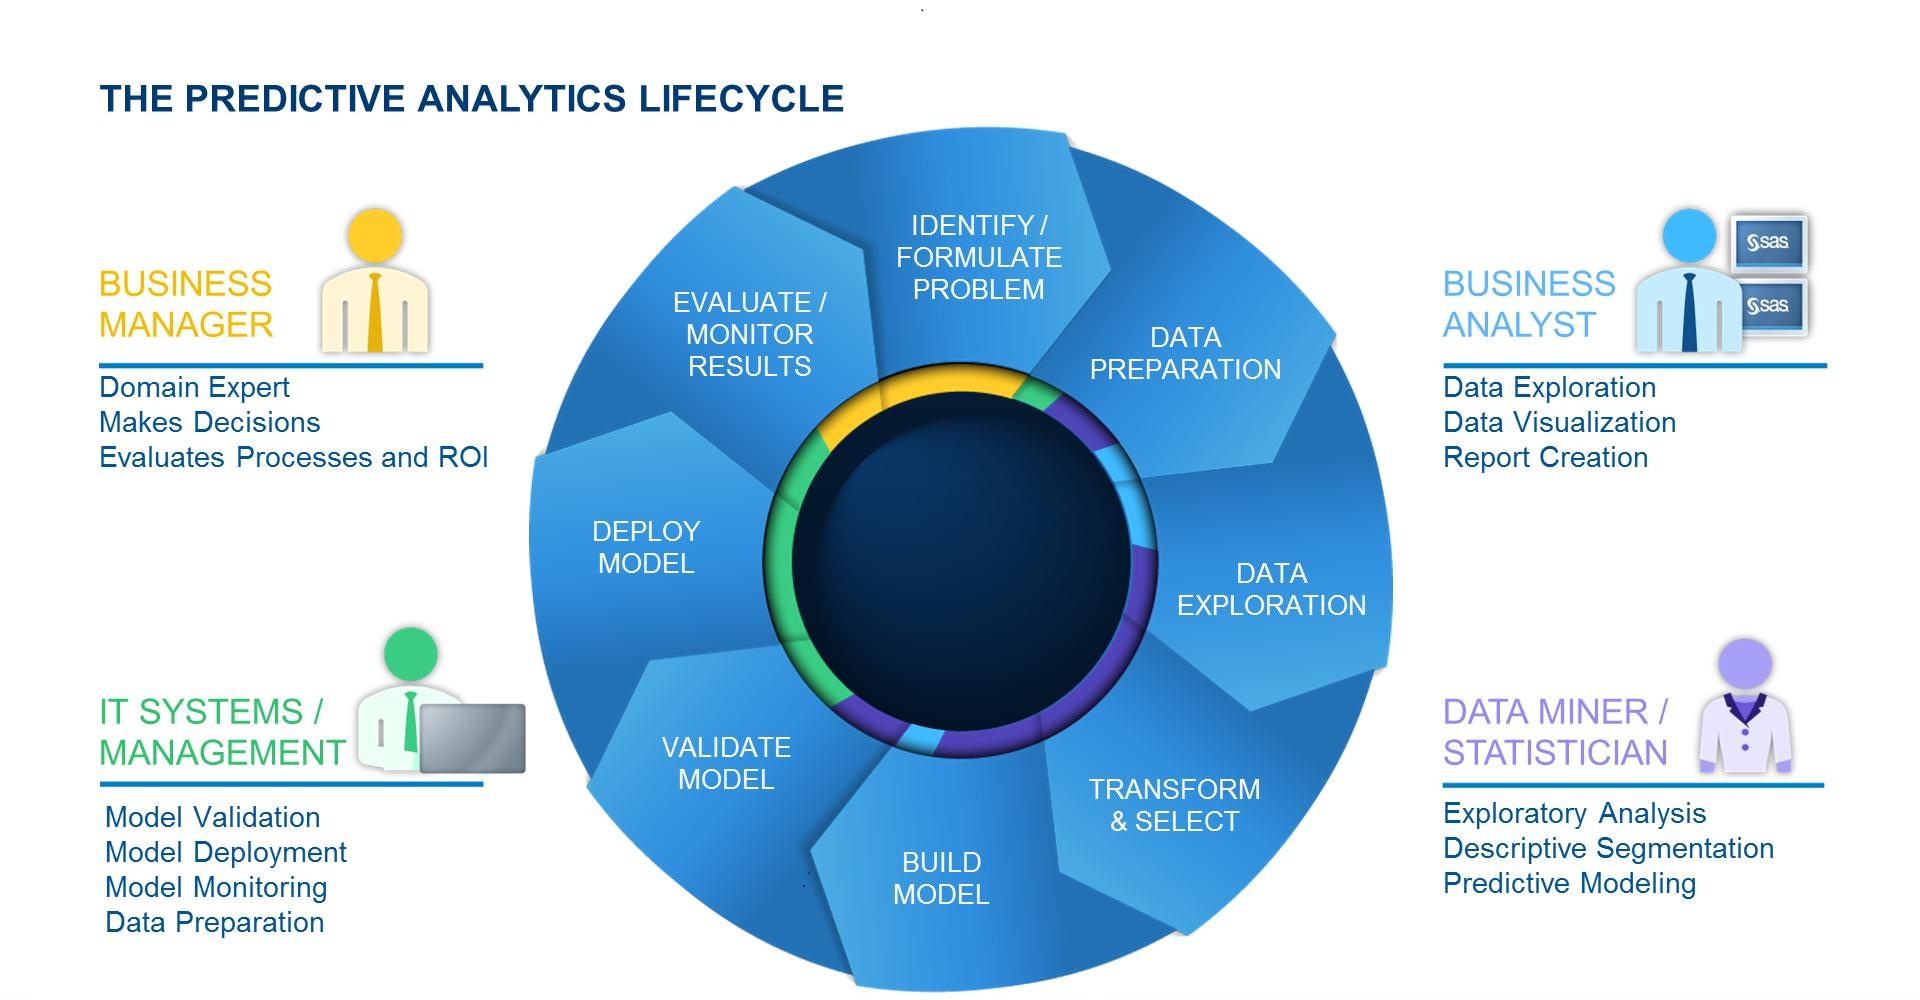

The increasing use of predictive analytics in mission-critical business decisions and operations brings new challenges to the forefront for many of our customers. Throughout the last year I spoke to many customers about their use of predictive analytics and where they see areas of improvement to achieve even more success
Anything that you do manually leaves the door open for error; this is especially true for your file system. Aside from that, automated processes are usually faster. Magnus Mengelbier has applied this philosophy to providing version control capabilities to SAS data sets, programs and outputs.
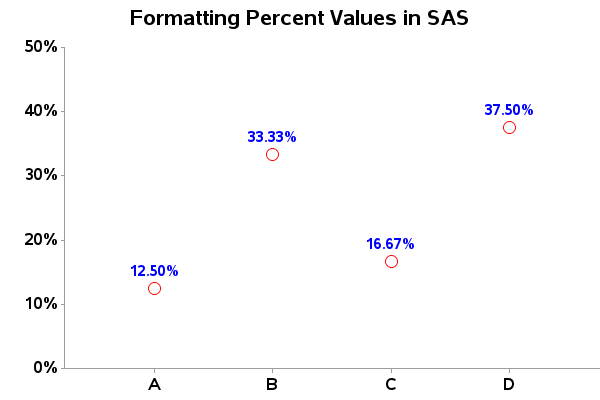
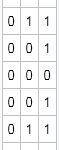
Being that 2013 is the International Year of Statistics, I wanted to make sure everyone knows how to handle my favorite statistic - percent (%) - in SAS! I often see data in spreadsheets/csv/etc that purport to represent "percents"... but you have to be a bit careful when working with
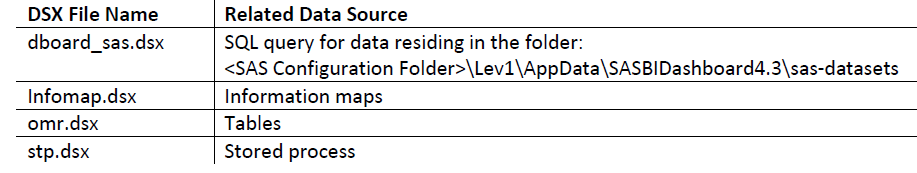
In version 4.3 of SAS BI Dashboard, data caching is not enabled by default. Each time a user opens a dashboard, each element on the dashboard executes a query to return the result. Enabling data caching can improve dashboard performance by generating data results in advance.
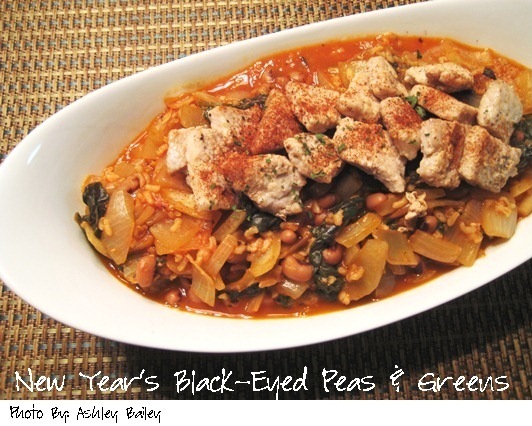

Happy 2013, it’s hard to believe another year has passed! New Year’s is typically a time for new beginnings and for many people New Year’s Resolutions. How many years have you vowed on January 1st to start eating healthier, lose weight, or hit the gym more? And how often have
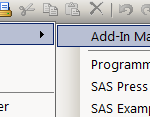

I've bragged about how easy it is to install custom tasks for SAS Enterprise Guide. It's simple: you copy the .NET assembly (usually a single DLL file) into one of the designated folders in your SAS Enterprise Guide installation, and your task just shows up in the menu. Since I
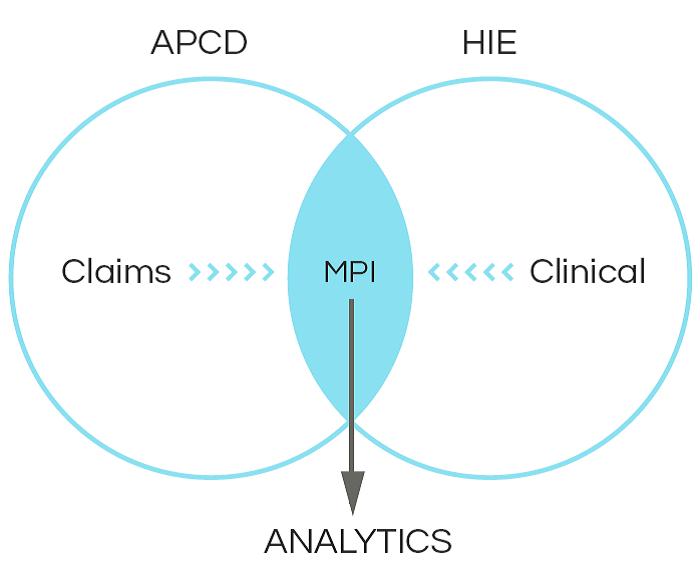

The creation of Health Information Exchanges (HIEs) took off in 2009 with the establishment of the State Health Information Exchange Cooperative Agreement Program (SHIECAP). Recently, it seems like HIEs have been somewhat of the middle-child, garnering less attention between the health insurance exchanges and Medicaid expansion. But let’s take a