All Posts

In my previous article on Adverse Event Timeline Graph, I wrote about how to create the AE timeline using SAS 9.2 code, using VECTOR plot and the MARKERCHAR option in SCATTER plot. I described a better way to place the labels at the lower end of the vectors. SAS 9.3 provides an easier way

I've got a new trick that you can use to track progress in a long-running SAS program, while using SAS Enterprise Guide. I've previously written about the SYSECHO statement and how you can use it to update the Task Status window with custom messages. SYSECHO is a "global" statement in


Over the holidays I was having a discussion with my cat, Ms. Trixie Lou. A question that often arises during the first programming class is the following: how do I find the variables that are in common to these two or three data sets? As it turns out, Ms. Trixie
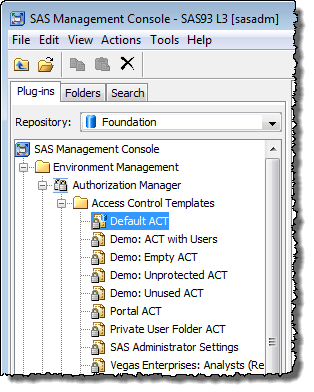

I think most people would agree that there's not much point in locking your front door if you're going to leave the keys in the lock. With a SAS platform metadata security implementation, it is just as important to ensure that the metadata access controls that you have carefully put

The SAS/IML language secretly creates temporary variables. Most of the time programmers aren't even aware that the language does this. However, there is one situation where if you don't think carefully about temporary variables, your program will silently produce an error. And as every programmer knows, silent wrong numbers are
Often it is desirable to use special Unicode characters for the tick value names on the axes. However, SG procedures and GTL do not support Unicode strings in SAS data sets. With SAS 9.3, the SGPLOT procedure supports annotation which does support Unicode strings. You can create an annotation data set


Windows 8 was officially released Friday October 26. This was Microsoft’s first operating system release since the introduction of Apple’s iPad and the subsequent surge in popularity of tablets. To align their OS with the new computing devices, Windows 8 has two interfaces to allow access from traditional desktops and laptops and
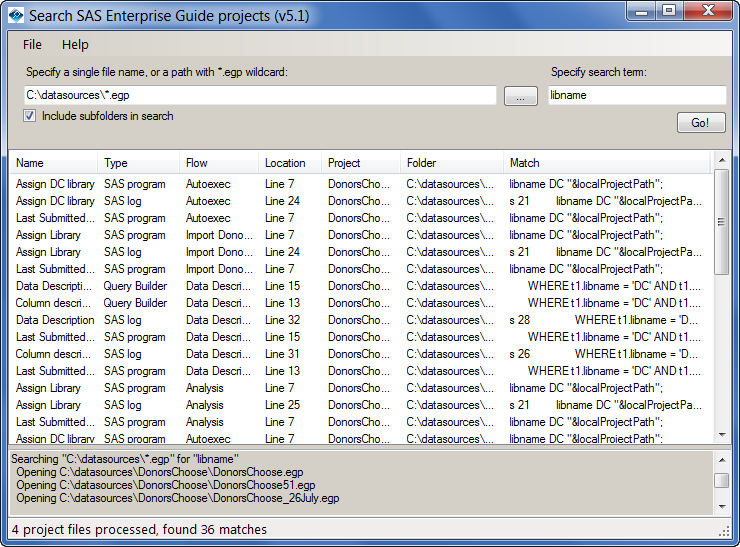
Last year I published an example application for searching your SAS Enterprise Guide project files (EGP files). The example shows off some of the cool features of the automation API, and it's a useful tool. As neat of an example as that was, it had some limitations. It worked only


Analytics is a key piece in nearly all 31 recommendations outlined in The Innovative DOT: A Handbook of Policy and Practice. Crafted by the State Smart Transportation Initiative, in partnership with Smart Growth America, the handbook provides 31 recommendations for state transportation officials looking for ways to increase efficiencies and


The traditional methods of making credit decisions relied mostly on human judgment; those have been replaced by methods that use statistical models. Today, statistical models are used not only for deciding whether to accept an applicant (application scoring), but also to predict the likelihood of defaults among customers who have


My team and I are often called on to help customers optimize SAS system performance, particularly when the root cause of performance problems is hard to track down. This is the first of a two-part article on practices and tools we’ve found most useful.


Super Bowl XLVII is almost here! Whether you’re a Ravens or a 49ers fan or just watching the game for the commercials, Super Bowl snacks always seem to take center field and are the true MVPs. According to an article from Huffington Post, Americans will eat nearly 11 million pounds
I like to be efficient in my SAS/IML programs, but sometimes I get into bad habits. Recently I realized that I was reshaping a bunch of SAS/IML row vectors because I wanted to write them to a SAS data set. This is completely unnecessary! The SAS/IML language will create a
A commonly requested graph is a bar chart with response and targets. With SAS 9.3, the SGPLOT procedure supports new "parametric" plot statements called HBARPARM and VBARPARM. These statements are special versions of the HBAR and VBAR statements and they expect summarized data for each category or category+group combination. Also,
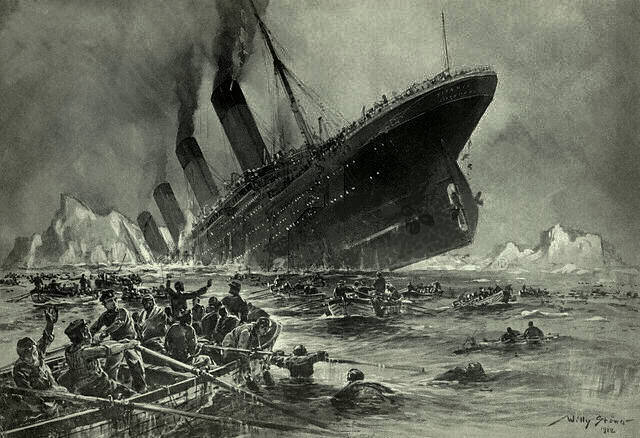

It was a moonless night in April 1912 when the pinnacle of ocean travel technology and luxury, the RMS Titanic, collided with an iceberg in the North Atlantic, resulting in the deaths of more than 1,500 passengers and crew. A primary cause of the tragedy was that the captain and