All Posts
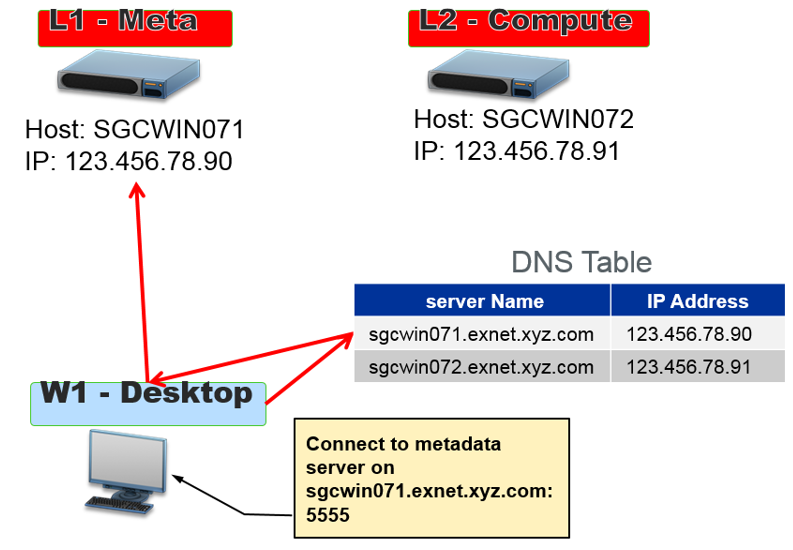

Like most SAS users and administrators, you usually don't know where your backend SAS servers are located--probably in some basement server farm or perhaps another building or even another town. But I'm sure you do know that your SAS client application must have a way to reach services running on
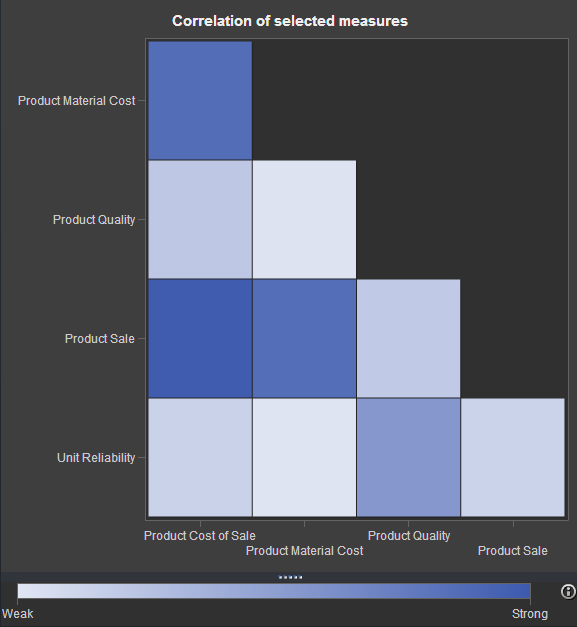

If you've watched any of the demos for SAS Visual Analytics (or even tried it yourself!), you have probably seen this nifty exploration of multiple measures. It's a way to look at how multiple measures are correlated with one another, using a diagonal heat map chart. The "stronger" the color


First of all, congratulations to everyone who presented at SAS Global Forum 2013. Your hard work and contributions are what make it a success each year. Even though SAS Global Forum 2013 has come and gone, all of the papers and presentations are still available online. Out of this fantastic
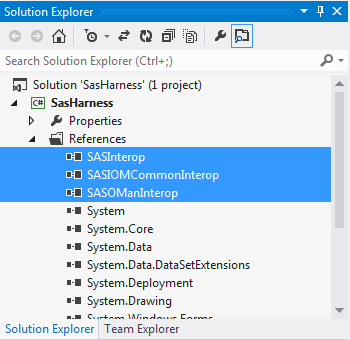
As part of my follow-up to SAS Global Forum 2013, I've posted a few articles about how to create your own client apps with SAS Integration Technologies. This article shows how to use Microsoft .NET -- the same approach used for SAS Enterprise Guide and SAS Add-In for Microsoft Office
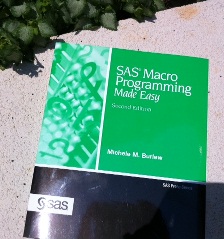

This week's SAS tip is from Michele Burlew and her book SAS Macro Programming Made Easy, Second Edition. Michele is the author of several extremely helpful SAS books. Visit her author page to learn more about her work and for additional free content. The following excerpt is from SAS Press


John Heaton is no stranger to the often frustrating process of migrating code between environments after software updates. While release management and version control may often be afterthoughts, Heaton cautions that ignoring them could be “time consuming and disastrous should errors occur.” His winning SAS Global Forum paper SAS® Release
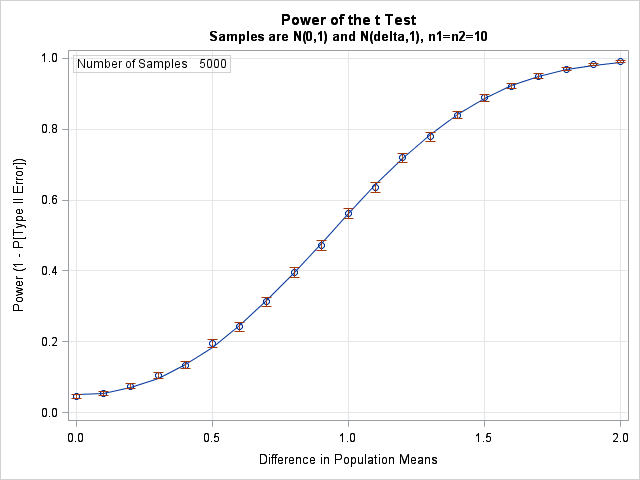

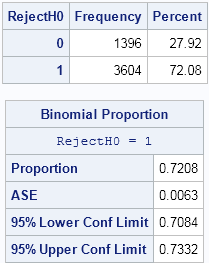
Last week I showed how to use simulation to estimate the power of a statistical test. I used the two-sample t test to illustrate the technique. In my example, the difference between the means of two groups was 1.2, and the simulation estimated a probability of 0.72 that the t

One of the great things about SAS libraries is that you can write your programs to read and write data without having to worry about where the data lives. SAS data set on a file system? Oracle table in a database server? Hadoop data in Hive? For many SAS applications,

A SAS user told me that he computed a vector of values in the SAS/IML language and wanted to use those values on a statement in a SAS procedure. The particular application involved wanting to use the values on the ESTIMATE and CONTRAST statements in a SAS regression procedure, but
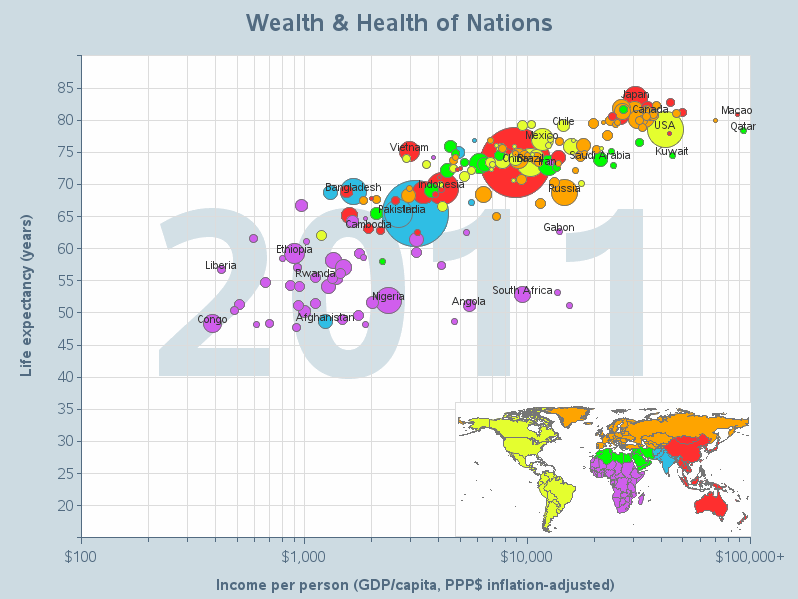

They say "Imitation is the most sincere form of flattery"... Therefore when I imitate Hans Rosling's famous world-data animation, it's not that I'm jealous, but that I'm paying homage to him! (OK, and maybe also a little bit jealous! LOL) Well, anyway, for those of you who haven't seen it,

Reading Jan Bigalke’s SAS Global Forum paper on “Hardening a SAS® Installation on a multi tier installation on Linux" reminded me of baking apple stack cake with my mother. Neither is a simple project. Both are time-consuming, and their success depends on how skillfully you handle each layer. Data security
The power of a statistical test measures the test's ability to detect a specific alternate hypothesis. For example, educational researchers might want to compare the mean scores of boys and girls on a standardized test. They plan to use the well-known two-sample t test. The null hypothesis is that the
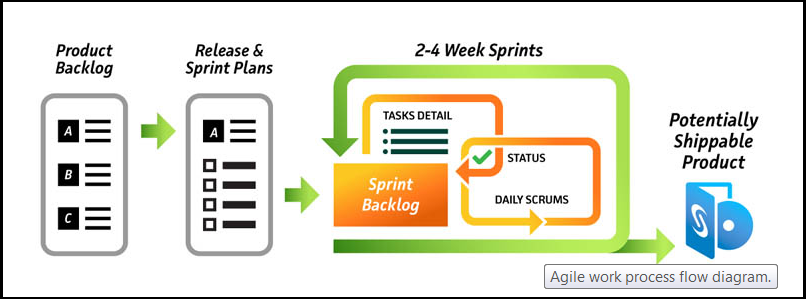

At SAS, one of our core values is to be swift and agile. So it makes sense that our software development be Agile too. The Agile methodology has been around for more than 10 years and was designed with software development in mind. Today, it is still used predominately for

Often we want to visualize the relationship between variables over time. The understanding of such data can be improved by viewing the animated graph over time. With SAS 9.4, you can create animated graphs using the new animation options on the OPTIONS statement and the PRINTER destination. A popular example an
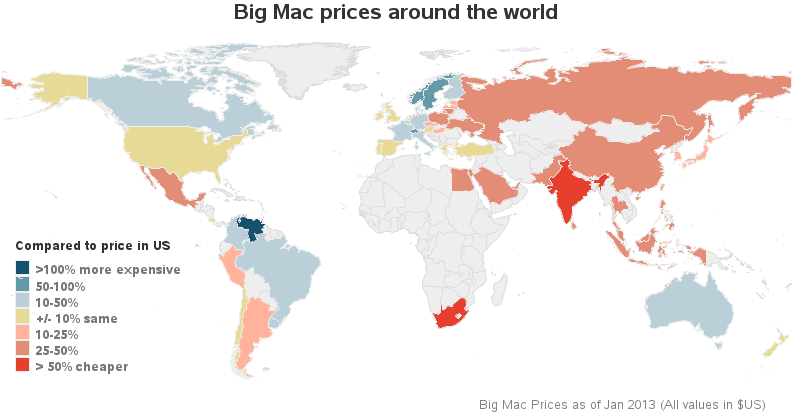
I recently read an interesting article in The Economist, where they describe "The Big Mac index." This is an index they invented as a lighthearted guide to compare currencies in different countries. In their article they create a multi-panel display (similar to a dashboard) where they compare the index for several countries using