All Posts


Missing San Francisco already? I caught up with the SAS Global Forum 2013 paper winners and asked them to share some of their insights about their work, the conference and what they took away from the experience. To kick off this series, I've posted their words of wisdom for other SAS Users. The question was
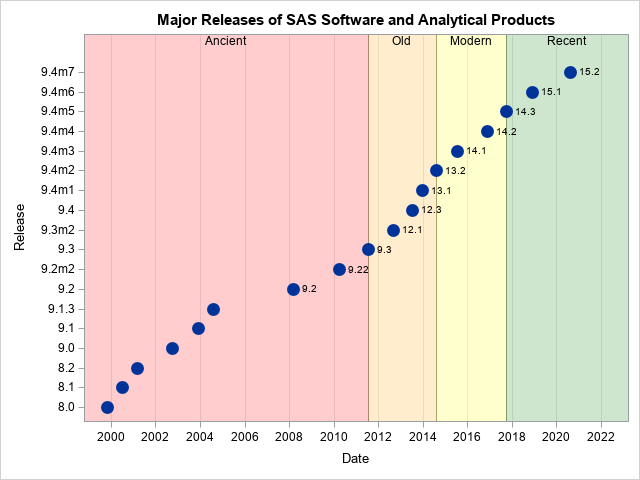

How old is your version of SAS software? The graph on the left shows the release dates for various releases of SAS software, beginning with SAS 8.0. The graph is based on a graph on Jiangtang Hu's blog that shows the major SAS releases up through the initial release of

At the SAS Global Forum 2013 in San Francisco, I presented a paper on making Patient Profile Graphs using SAS. You can follow the link to see the graphs presented in this paper. In that paper, I presented ways to create AE, CM, VS and Lab graphs. I discussed aligning the


Previously I've described how you can use SAS Enterprise Guide to send an e-mail message using Gmail as your e-mail provider. In the article, I mentioned that you can also write SAS programs that send e-mail messages, but at the time you could not reach Gmail using the FILENAME EMAIL


Users often ask if there are any major tuning efforts that need to be made in order for SAS to execute ideally in a virtual environment. The quick answer is "not really". The longer answer is “it helps to set up your virtual environment properly.” There are a few minor

From an Enterprise Guide user's perspective, a SAS library is a library. Whether it was defined in the autoexec or in the metadata or by magic, it is there for them to use with no issues. However, there is a difference as metadata defined libraries do not behave in the
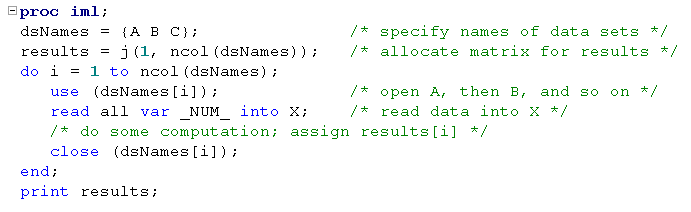
One of my favorite features of SAS/IML 12.1 (released with 9.3m2) is that the USE and CLOSE statements support reading data set names that are specified in a SAS/IML matrix. The IMLPlus language in SAS/IML Studio has supported this syntax since the early 2000s, so I am pleased that this
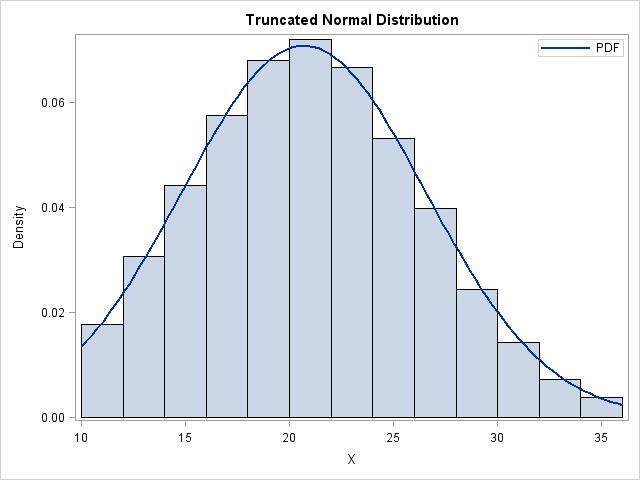
The truncated normal distribution TN(μ, σ, a, b) is the distribution of a normal random variable with mean μ and standard deviation σ that is truncated on the interval [a, b]. I previously blogged about how to implement the truncated normal distribution in SAS. A friend wanted to simulate data

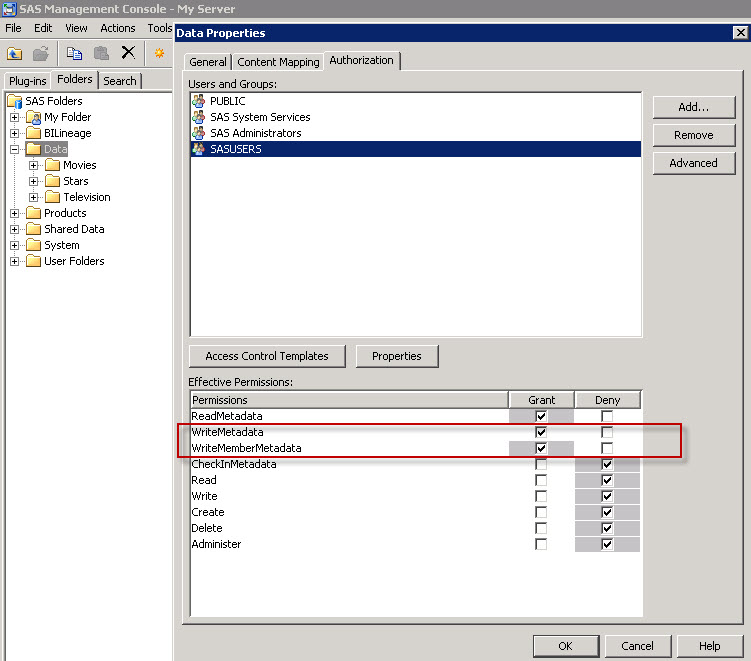
Christina Harvey recently forwarded this question from SAS user Bob Wasicak to several administrators here at SAS: “Does the metadata layer capture the number of login's per user? And how can I get at it? I have been using the metadata browser but would like to write a query to extract

Tofu can be a great addition to your protein rotation. I love tofu! I've been eating it for almost 20 years and have tried it almost any way you could think of. I am always amazed when people turn up their nose at tofu, and they’ve never even tried it!

Professional development, popularity, untold fame: the benefits of submitting a paper to a SAS conference are certainly varied and widespread! In a recent SAS Users LinkedIn discussion started by David Corliss, avid SAS users and former presenters discussed their motivations for writing, researching and presenting papers. From the many wonderful
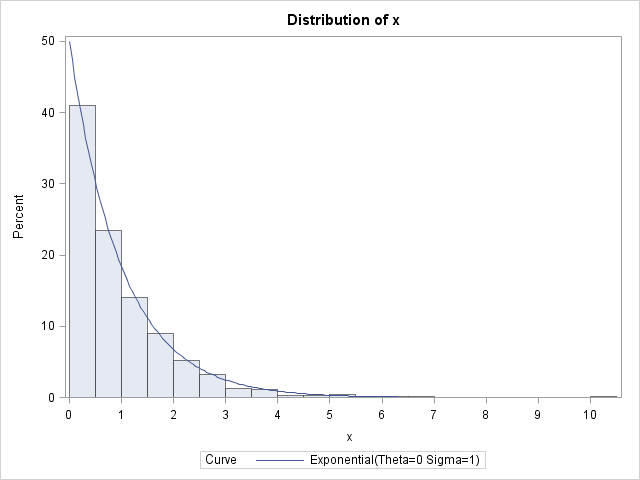
There are many techniques for generating random variates from a specified probability distribution such as the normal, exponential, or gamma distribution. However, one technique stands out because of its generality and simplicity: the inverse CDF sampling technique. If you know the cumulative distribution function (CDF) of a probability distribution, then

SAS Global Forum is a three-day, education-focused and energy-packed conference – created by SAS users, for SAS users. Next year’s event will be in Washington D.C., March 23-26. Featuring the best and brightest SAS users and experts from all over the globe, SAS Global Forum 2014 offers the SAS community the chance
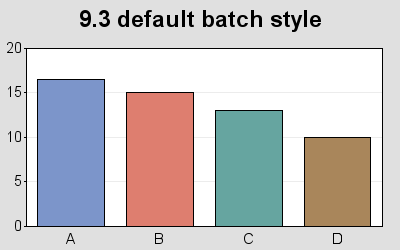

ODS graph styles provide users with an easy way to control things such as the colors and fonts used in a graph, freeing the user from having to specify these properties in their code. A lot of thought was given to picking colors that work well together, and look good. The

I love tables. As a writer, there's nothing more satisfying to me than distilling complicated information into neat rows and columns. That's one of the features that caught my eye in SAS User ID and Password Usage Rules. The other is its potential usefulness for SAS administrators who manage SAS