All Posts

The SAS 9.4 Maintenance 1 release is now shipping to users. This is great news for GTL and SG procedures users as this release includes some useful new features. Some of these are in direct response to your requests, and others are enhancements that we think you will come to like.
Often we have situations where the category values on the graph have long character strings. This is often the case when graphing survey responses to questions. The questions may be sentences, sometimes moderately long. With SAS 9.4, GTL and SG now support the ability to display tick values split over

If there's anyone who represents the global nature of SAS software, it's Falko Schulz. He's a German who lives in Brisbane, Australia while he works for SAS R&D based in Cary, NC. Falko works on the team that produces SAS Visual Analytics, specifically the "explorer" portion of the tool. He
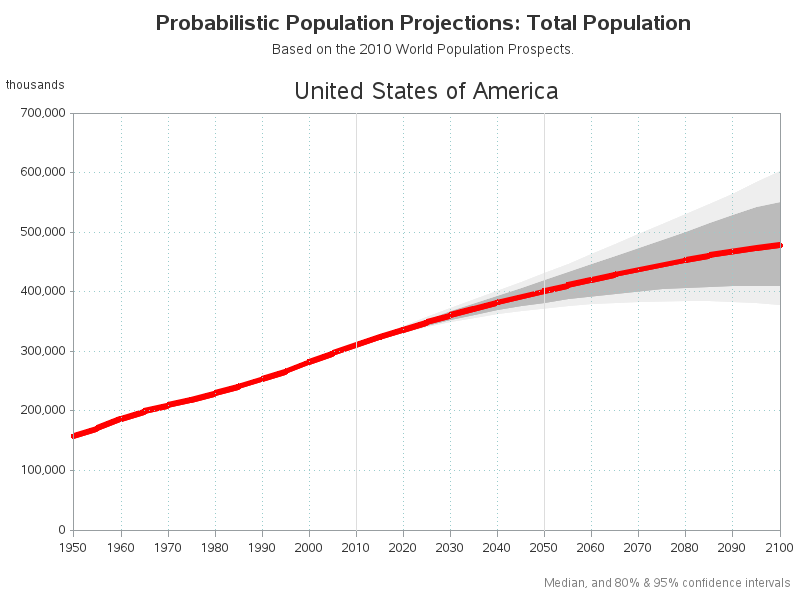

The farther you try to forecast into the future, the less certain you are -- how can you represent that graphically? One way is to draw a shaded/colored "confidence interval" around your forecast line, but this is something a lot of SAS users have trouble with. That's why I decided to create
Being so close before Christmas I thought it would be a good idea to see what route Santa Claus is planning this year. Not just because I'm living in Australia and Santa usually comes in t-shirts & shorts but also because it's a long way to get down here. So


We want to extend a huge thank you to everyone who donated their leftover (and excess) Halloween candy this year, you outdid yourselves!! We tipped the scales at more than 220 pounds of candy- 65 more pounds than we collected last year! Wondering what happened to all that Halloween candy?


This is the time of year when we like to make predictions about the upcoming year. Although I am optimistic about the potential of predictive analytics in the era of big data, I am also realistic about the nature of predictability regardless of how much data is used. For example, in
Creating a Bar Chart with a table of statistical data aligned with the bars is a popular topic. With SAS 9.4, creating such graphs gets easier with the new AXISTABLE statement in GTL and SG procedures. But some use cases can flummox the latest gizmos. Such is the case I ran into recently. Here
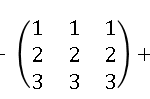

Recently a SAS/IML programmer asked a question regarding how to perform matrix arithmetic when some of the data are in vectors and other are in matrices. The programmer wanted to add the following matrices: The problem was that the numbers in the first two matrices were stored in vectors. The
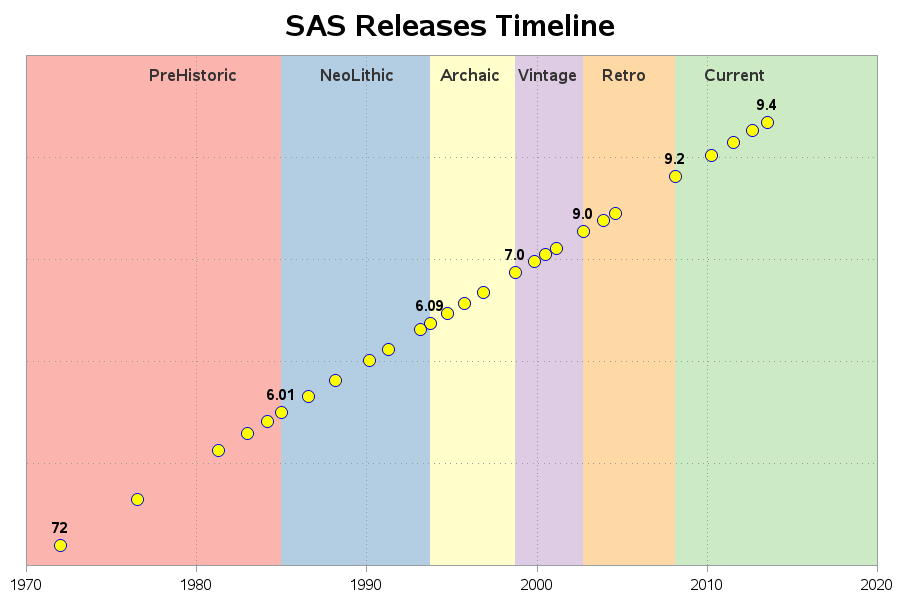
Data on punched-cards, SAS software delivered on tape, jobs in the queue on the mainframe, printouts on green-bar paper ... we really appreciate all our SAS users, but if any of the above are part of your "SAS memories" we especially appreciate you! I guess I'm a computer geek, because
Last week I covered some of the interesting graph-related papers presented at WUSS. There were quite a few, so I broke up the report into two parts. Here is the second installment. In the paper Creating Graphical Patient Profiles using SAS by William Garner of Gilead Sciences, the author describes how to create
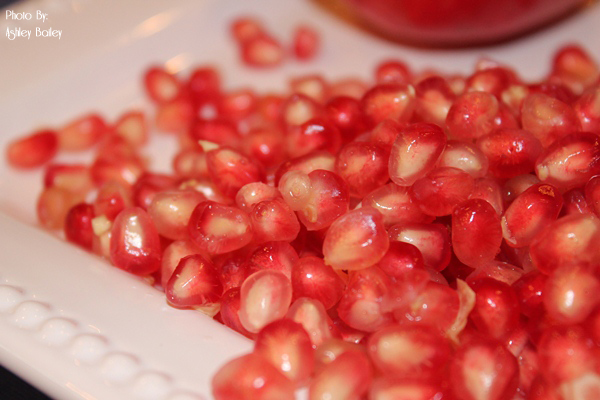
Pomegranates are popping up everywhere and are in everything from ice cream and rice cakes to body wash and even candles! So what’s the big deal about pomegranates?

When learning a new language, it is important to learn to interpret error messages that come from the language's parser or compiler. Three years ago I blogged about how to interpret SAS/IML error messages. However, many questions have been posted to the SAS/IML Support Community that indicate that some people
It is always a pleasure to attend SAS user conferences, regional conferences and in-house events. In addition to presenting papers, seminars and super demos to the attendees myself, my favorite activity is to attend presentations by users that include graphical data visualization. These include using SG procedures, GTL, Designer or SAS/GRAPH. This year
Each year my siblings choose names for a Christmas gift exchange. It is not unusual for a sibling to pick her own name, whereupon the name is replaced into the hat and a new name is drawn. In fact, that "glitch" in the drawing process was a motivation for me