All Posts


Ask any user how they first learned SAS and there’s a good chance they’ll cite The Little SAS Book as a resource they used to get started. Authors Lora Delwiche, Susan Slaughter, and Rebecca Ottesen have written a new book that promises to be just as helpful to new SAS

I realized a little while ago that I may have more loyalty cards and memberships than the average person. (And that I more actively prove my loyalty than the average person). But as anybody who has ever signed up to a mailing list or for a store card knows, having

SAS/OR 14.1, which became available on July 14, delivers a number of new and enhanced features in optimization and simulation. These changes are designed to make SAS/OR even easier to use and to enable you to model and solve larger, more complex problems more efficiently. If you're using SAS/OR now,

Since our last VirtualOil update in May, oil prices have continued to take a beating. As the chart of the rolling five-year portfolio shows, much of our strip of options is now out-of-the-money and the average value per barrel of that optionality has sunk below $7. No surprise then that

with Natalie Osborn, Senior Industry Consultant, Hospitality and Gaming Practice, SAS. It’s back to school time, and back to school reminds me of getting back to the basics. So, we thought we’d start the fall with a “back to the basics” refresher series on analytics. To accomplish this, Natalie and


Suppose you wish to select a random sample from a large SAS dataset. No problem. The PROC SURVEYSELECT step below randomly selects a 2 percent sample: proc surveyselect data=large out=sample method=srs /* simple random sample */ n=1000000; /* sample size */ run; Do you have a SAS/STAT license? If not,


I think everyone can agree that being able to debug programs is an important skill for SAS programmers. That’s why Susan Slaughter and I devoted a whole chapter to it in The Little SAS® Book. I don’t know about you, but I think figuring out what’s wrong with my program


I have been working on streaming analytics in conjunction with a project at Duke Energy, so a few months ago I was contacted by a colleague who wanted to look at the feasibility of applying what I’ve learned to our Internet of Things (IoT) initiative. In particular, we wanted to see if


As Gerry Nelson pointed out in an earlier post on 9.4M3, a new interface to the SAS Backup and Recovery Tool is available from the Administration application in SAS Environment Manager. This new SAS Backup Manager interface makes scheduling regular backups and executing ad hoc backups extremely easy to do


This is my final entry in the Education Meets Big Data blog series. Let’s review what we've covered so far… In my first post, I explained that statewide longitudinal data systems (SLDSs) track student data from preschool through college and workforce across the state. SLDSs can be used to see one


Big Data has become a technology buzzword. But how is Big Data changing insurance? Historically, insurance companies have used SMALL data to make BIG decisions. Today, insurers are using BIG data for SMALL decisions. What does this mean? Traditionally, insurance companies have aggregated data to group risks into broad categories


The digital disruption phenomenon is redrawing the market map. New players, products and services are gaining competitive advantage, while traditional business and revenue models are being questioned. Gartner believes that by 2020, thanks to the Internet of Things, information will be used to reinvent, digitalize or eliminate 80% of business
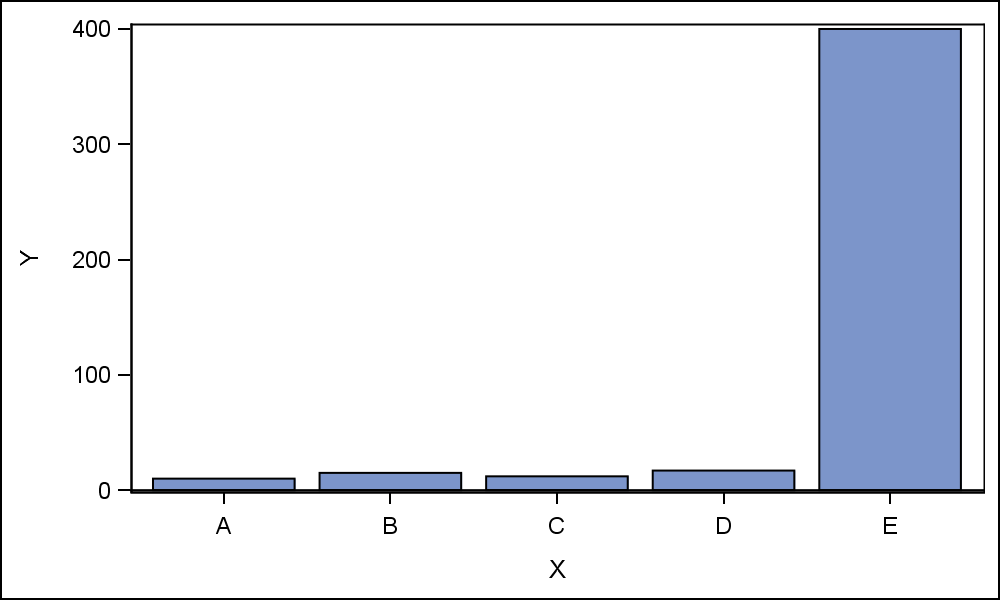

Often when the data includes some extreme difference in measures or some outliers, the plot of the data points can get skewed due to the need to accommodate the extreme outliers. The bulk of the observations get squeezed into a smaller region of the plot. While this may be useful


While I was in college, perhaps the lecture that stood out most to me was on proper running form from a Strength & Conditioning class. It wasn’t something I ever really thought about before. My only focus had been getting through my runs without dying! However, whether you are a serious marathon

Integrating big data into existing data management processes and programs has become something of a siren call for organizations on the odyssey to become 21st century data-driven enterprises. To help save some lost time, this post offers a few tips for successful big data integration.