All Posts

We’ve been talking about data recently at the Analytic Hospitality Executive. I’ve advocated to use whatever data you have, big or small, to get started today on analytic initiatives that will help you avoid big data paralysis. In this blog, I’m going to get a bit more technical than usual


Durante los últimos años, Tamara Dull, directora de tecnologías emergentes para SAS Best Practices, ha escrito mucho sobre Big Data. Sus conclusiones son interesantes: pensamos que el big data es algo nuevo, pero la verdad, hemos lidiado con él durante años; el correo electrónico, las fotos, los videos, los archivos

What's that productivity related quote by Charles Dickens? "My advice is never do tomorrow what you can do today." For years, machine learning has been written about and discussed widely with a focus on the benefits it will bring in the near future. But guess what? The future for machine learning


The SAS Visual Analytics 7.2 release introduces a new look and feel to the Hub with the modern (HTML5) version. It also introduces a new feature, Shared Collections, which allows an administrator to push a Shared Collection to all users’ Hub view, including Guest access. And bonus - it will


One of the most important skills for data scientists and business analytical professionals is communications. If decision makers and managers don't understand what the numbers mean -- results won't turn into action. Jeff Zeanah, President of Z Solutions, Inc. has been presenting on the topic of speaking “analytics” for many


As a new mom, I’ve been trying to provide the healthiest foods possible for my family that don’t have added chemicals and unnecessary ingredients. According to the 2015 Nielson Survey, I’m not alone in this journey! Consumers are going back to the basics with about 4 in 10 global respondents


Many of you know that I have lived for over a decade in an under-resourced neighborhood in Durham. I love my neighbors and my community. And I have learned the truth of Aboriginal activist Lilla Watson’s sage axiom, “If you have come to help me you are wasting your time; but
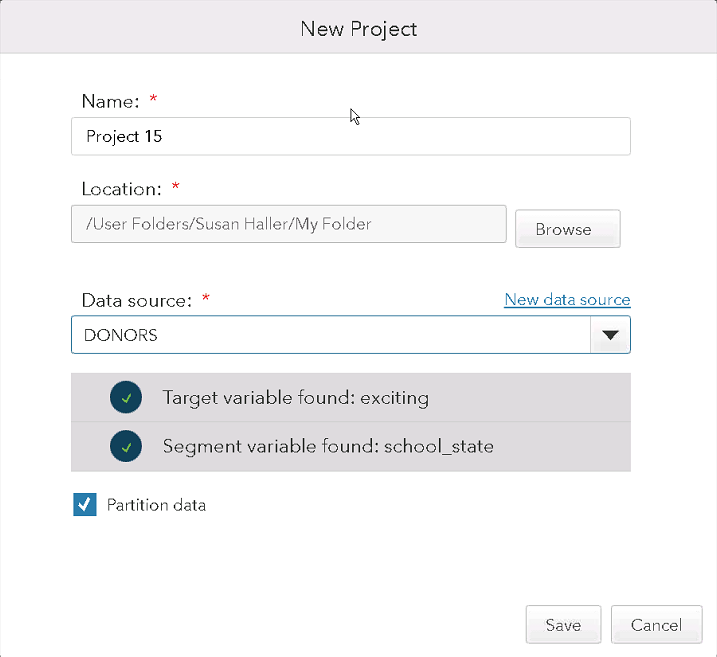

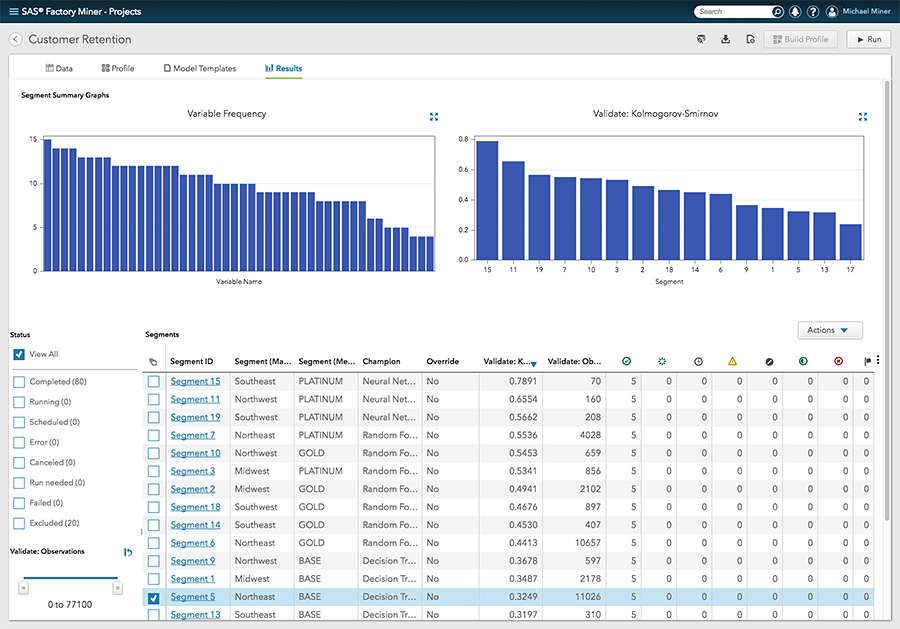
On July 14, 2015 SAS released SAS Factory Miner, our latest advanced data mining and machine learning product. This new product provides automated predictive modeling by segment in a high velocity grid enabled environment, allowing modelers to run hundreds of models within minutes and find champion models by segment quickly.


There's a lot of talk right now about the Internet of Things and how it's likely the prime catalyst for the digital transformation of organizations over the next few years. Billions of sensors, and devices with sensors, all generating data in a hyper-connected world where it can be easily shared


I'm gearing up to teach the next "DS2 Programming Essentials with Hadoop" class, and thinking about Warp Speed DATA Steps with DS2 where I first demonstrated parallel processing using threads in base SAS. But how about DATA step processing at maximum warp? For that, we'll need a massively parallel processing


I’ve had a lot of discussions with business leaders around the discrepancy between big data investment fears and successful use cases. Most of them say that "the quest for the golden use case" takes too much time and is usually not successful in the end. Ultimately, this quest can lead to
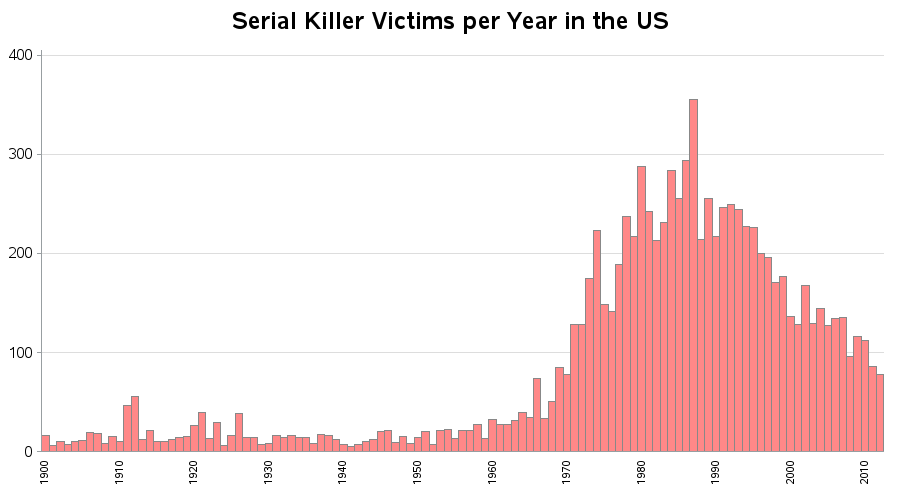

I recently came across some very interesting data on serial killings ... but it was in tabular/text form. This seemed like an invitation for me to create some graphs that make it easier to understand the data. It seems many people have a morbid curiosity about serial killers. For example, some
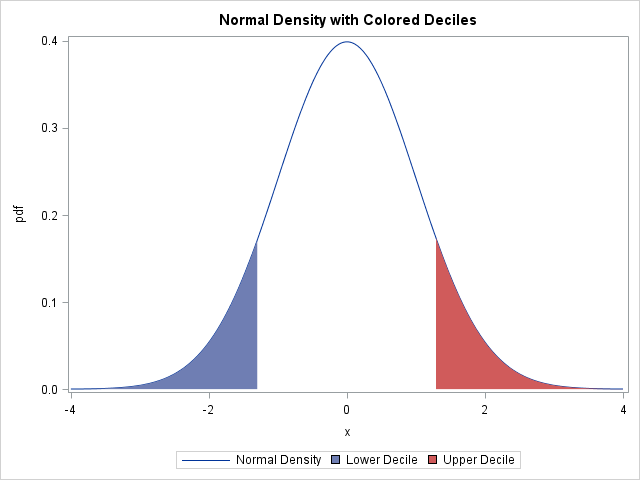

A SAS programmer wanted to plot the normal distribution and highlight the area under curve that corresponds to the tails of the distribution. For example, the following plot shows the lower decile shaded in blue and the upper decile shaded in red. An easy way to do this in SAS

Parte de la Estrategia Digital Nacional (EDN) es implementar una Salud Universal y Efectiva que optimice los servicios de salud para los mexicanos. A través del uso de las TIC, el gobierno busca aumentar la cobertura de los servicios, así como mejorar la accesibilidad y las infraestructuras. Como objetivos secundarios de este

Operationalizing data governance means putting processes and tools in place for defining, enforcing and reporting on compliance with data quality and validation standards. There is a life cycle associated with a data policy, which is typically motivated by an externally mandated business policy or expectation, such as regulatory compliance.