All Posts
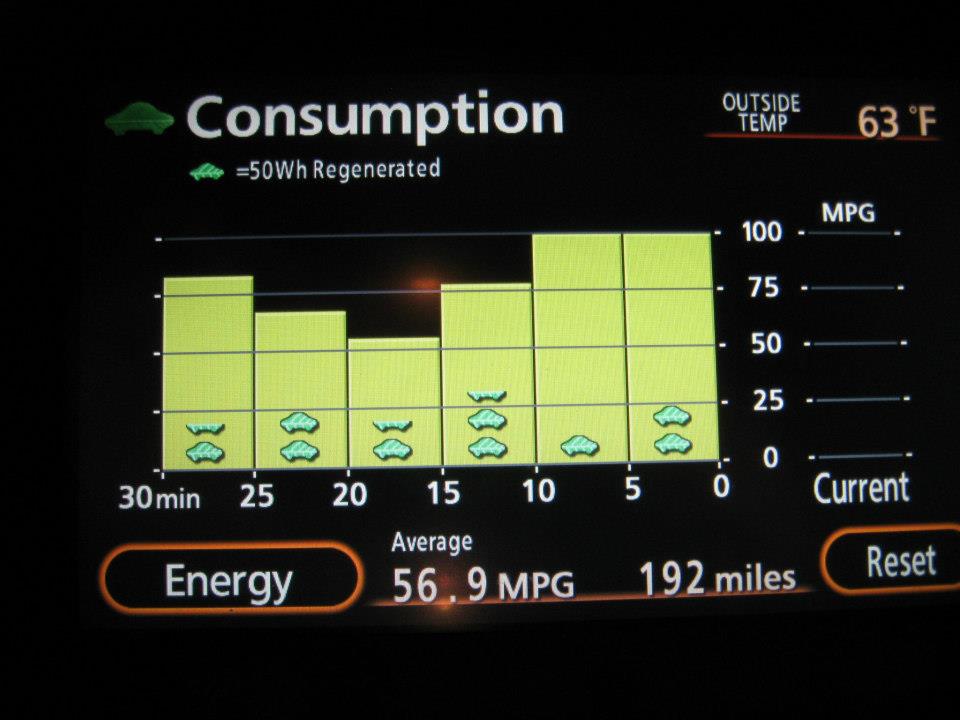

When the Toyota Prius first came out, the gas mileage claims astonished everyone. But now that almost every manufacturer offers their own hybrid, is the Prius mpg really all that great? Let's analyze the data ... But before we get to the analytics, let me tell you a little about
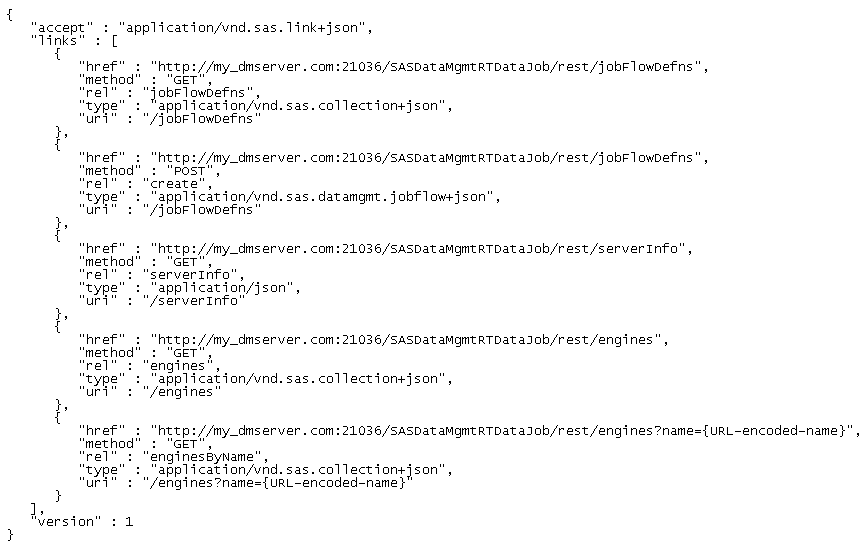

REpresentational State Transfer (REST) is an architectural style for designing web services that access a system's resources using HTTP methods. With the release of DataFlux Data Management 2.7 earlier this year, three new REST Application Programming Interfaces (APIs) are now available: Data Management Server Batch Jobs Data Management Server Real-time


¿Cuáles son los retos del sector financiero en Latinoamérica? ¿Cómo detectar y prevenir el fraude en los bancos y empresas de seguros de una vez por todas? ¿Podemos reducir el riesgo de pérdidas relacionadas con estas conductas fraudulentas? ¿Cómo minimizar los daños e impacto en la reputación organizacional? La lucha


Al momento de redactar este articulo recordé una nota que describe el actual entorno en las organizaciones bancarias, de gobierno, aseguradoras y salud citada del Profesor David J Hand en su libro titulado "Fraud Analytics Using Descriptive, Predictive, and Social Network Techniques", "Fraud will always be with us". Esta línea


What do you get when you add together: Two basketballs; six people wearing black or white t-shirts; and a chest-beating gorilla? Oddly enough, a great analogy for the challenges information security professionals constantly face (more on that in a minute ...). We'll be talking about security challenges of all kinds


Last week a question was posted on the communities page about creating Box Plots where the width of each box is proportional to the frequency for the category. The comment was that PROC BOXPLOT can create such a graph, but there seems no way to do this using the SGPLOT
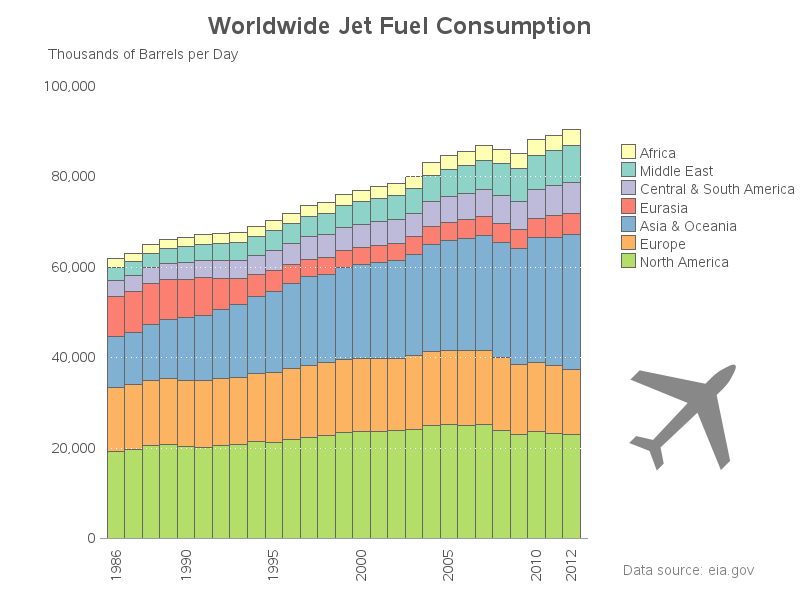
Did you ever wonder how much fuel all the jets in the world use? Perhaps these graphs will help you get a handle on it... Before we get started, here's a jet-fuel related picture to entertain you. This is a picture I took from the airplane when I went to


Back before storage became so affordable, cost was the primary factor in determining what data an IT department would store. As George Dyson (author and historian of technology) says, “Big data is what happened when the cost of storing information became less than the cost of making the decision to


North Carolina has over 300 miles of wide, flat Atlantic beaches as well as the highest mountain in the eastern United States, Mount Mitchell. The variety is impressive for a state that isn't even in the top half of the 50 states by size. One key reason is geometric: North Carolina


A recent survey by Capgemini found that 78% of insurance executive interviewed cited big data analytics as the disruptive force that will have the biggest impact on the insurance industry. That’s the good news. The bad news is that unfortunately traditional data management strategies do not scale to effectively govern


It's a Friday in February...that means it's time for another guest blog! This week's relationship series blog post comes from Gupta Psychiatry; providing insight and encouragement for those preparing to re-enter the dating world. Batter Up! Dating the Second Time Around A Collaborative Piece By: Dr. Mona Gupta, Amy Murray,


En México existen más de 60 millones de internautas, personas que comparten su información en múltiples plataformas, ya sea para darse de alta en su perfil de Facebook o incluso realizar una compra en línea, por lo que Internet se ve plagado de potenciales atacantes, disfrazados de supuestos usuarios legítimos,


This is my first blog post, and the first of a long series around Data Governance. The first thing I want to discuss is the ability to Share DataFlux Data Quality profiling metrics in SAS Visual Analytics. This post will illustrate how to extract profiling data from the DataFlux repository


Creating a strategy for the data in an organization is not a straightforward task. Not only does our business change – our software solutions also change before we can ever get done with a data strategy. So, I choose to understand that a strategy has a vision, and my vision may change


Last year at Mobile World Congress (MWC), we saw the reality of the IoT come to fruition. We saw leaders like AT&T showing their prototypes of connected cars, containers, agricultural sites, homes, etc. And it's got me wondering what we'll see at the 2016 MWC. In 2015, communications and media