All Posts


In the past, configuring a new autoload library for SAS Visual Analytics was a manual process involving steps to create very specific folder structures and to copy and edit scripts and SAS programs. No more! Updates to the SAS Deployment Manager have added a new task that creates and configures new autoload libraries


The journey continues as we hear from the instructors for each of the courses being offered on Thursday and Friday, April 21 and 22 after SAS Global Forum. Next up is Mark Jordan who developed and will teach the Introduction to DS2 and Hadoop course. Why should people get excited


.@philsimon on the specific risks to data quality posed by cloud computing.


Mix up your strength training routine with the RFC's Workout of the Month! April's featured equipment is Resistance Tubing - a great option for both in the gym and "on-the-road" workouts.

How comfortable are you with hard decisions? If it affected you, how comfortable would you be with losing your agency and having someone else make the decision for you? What if that decision isn’t made by a person but a machine? More than abstract questions, these are going to become


I have written a new book: Basic ODS Graphics Examples. It is available as a free PDF file on the web. It is in color, and all of the SAS code is available by double clicking a link at the beginning of each example. This new book complements my other


I recently read the book "Die Zahl die aus der Kälte kam" (which would be The Number That Came in from the Cold in English) written by the Austrian mathematician Rudolf Taschner. He is ingenious at presenting complex mathematical relationships to a broader audience. One of his examples deals with

The Analytics conference series is getting a modern makeover. And it’s not just a new name. The Analytics Experience, Sept. 12-14 at the Bellagio in Las Vegas, is bringing thought leaders and analytics gurus together for one big event. So whether you’re a geek or a suit you can create


While the growth of big data is an issue that preoccupies both the public and private sector, it’s also high on the UK government’s legislative agenda. All eyes are currently on the authorities, as we wait with bated breath to see what’s next in the quest to manage data escalation.


Does it upset you when you log onto your healthcare insurance portal and find that they spelled your name wrong, have your dependents listed incorrectly or your address is not correct? Well, it's definitely not a warm fuzzy feeling for me! After working for many years in the healthcare, pharmaceutical and


The SAS Environment Manager Report Center is a set of SAS stored processes and SAS macros which leverage the SAS Data Mart for the purpose of monitoring and auditing a SAS installation. Full documentation on the structure and functioning of the Data Mart can be found in the SAS Environment Manager
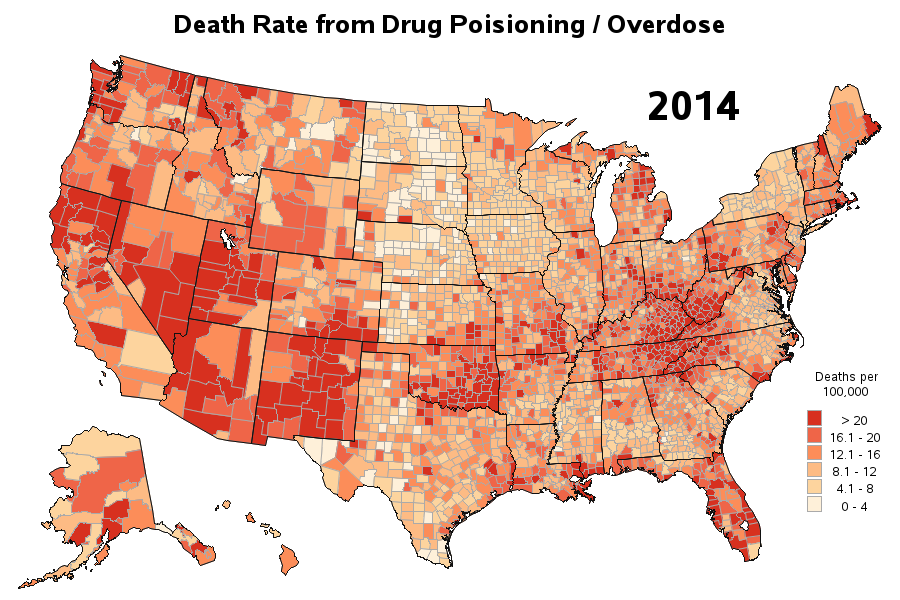

Lately I've seen several articles about drug overdose deaths being on the increase. But I didn't really like the graphs in those articles, so I tried to create some better ones using SAS ... For example, here's a map from the National Center for Health Statistics website (see the 3rd dashboard/tab

The journey continues as we hear from instructors for each of the courses being offered on Thursday and Friday, April 21 and 22 after SAS Global Forum. Our next stop is with instructor David Ghan who is teaching the Using SAS® Programs to Execute Pig and HiveQL in Hadoop and


Hace un par de semanas se impartió el webinar en Innovación Gubernamental: Soluciones Analíticas para el Sector Salud, en donde nos platica acerca de la importancia de la Analítica en el cuidado de la Salud. “Se predice que las computadoras electrónicas digitales asumirán un importante papel en la medicina…" William R.


In 2012, the value of big data equity in the UK was estimated at £12 billion a year or 0.7 percent of the annual Gross Domestic Product (GDP). Four years flew by and the second report by the Centre for Economics and Business Research (Cebr) puts the opportunity at £46