All Posts


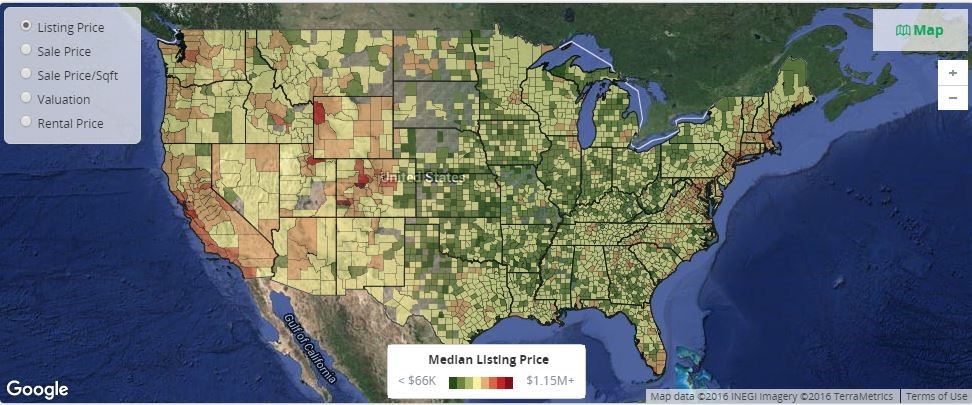
There are many situations where it is beneficial to display the data using a polar graph. Often your data may contain directional information. Or, the data may be cyclic in nature, with information over time by weeks, or years. The simple solution is to display the directional or time data

We live in a complex world that overflows with information. As human beings, we are very good at navigating this maze, where different types of input hit us from every possible direction. Without really thinking about it, we take in the inputs, evaluate the new information, combine it with our


Mix up your strength training routine with the RFC's Workout of the Month! July's featured equipment is the BOSU. The BOSU was originally created to improve athletic performance, however, it quickly entered mainstream gyms as well as rehab facilities due to it's versatility as a balance, stability, and core strength tool.


It’s clear from the minute you step into Accenture’s Digital Innovation Center (Future Camp) in Kronberg, Germany, that you're stepping into the future of innovation. The writing is literally on the walls, and everything you need to inspire big ideas – from brightly colored furniture to racks and racks of gadgets


I look forward to SAS Global Forum each year and this past conference ranked up that as one of the best I've ever attended. This year there were so many wonderful presentations, Super Demos and workshops on the topic of administration of SAS and the underlying hardware infrastructure needed for SAS


Data scientists are familiar with prototyping - we do this as part of a well-understood process to arrive at the optimum solution. But prototyping is more than about perfecting the math; it should also be about testing interpretability of the results. This need comes into stark prominence when you start

Let’s go back to 1976 for a moment. Did you know that was the year Muhammad Ali introduced a line of beauty products called “Knock Out?” And the hottest merchandise, including t-shirts, posters and even beanbags sported the character Arthur Fonzarelli (The Fonz) of TV’s “Happy Days.” But there was something


Throughout my 10 years at a leading direct marketing and CRM agency, a chief issue we solved for our clients was what we affectionately referred to as a spaghetti junction. It’s a nickname often given to a massively intertwined road traffic interchange that resembles a plate of spaghetti, like this


At some point, your business or IT leaders will decide – enough is enough; we can't live with the performance, functionality or cost of the current application landscape. Perhaps your financial services employer wants to offer mobile services, but building modern apps via the old mainframe architecture is impractical and a replacement

As a hospice social worker I considered it one of my roles to remind patients and families to take moments to slow it down; to look around at the person they were about to lose and the people who were about to experience the loss. I knew it was time
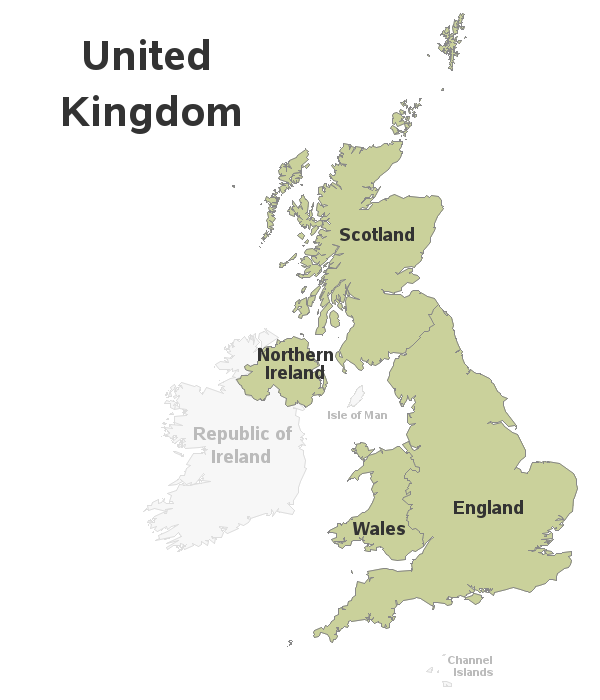

With the recent vote for the United Kingdom to leave the European Union being all over the news, I was a bit embarrassed to realize I didn't know exactly what areas are (and aren't) considered part of the UK. After a few Google searches, I found the following map on the


Over the last ten years, utilities around the world have have invested billions of dollars in the Internet of Things (IoT). Better known as smart grid and smart meter initiatives, this massive intelligent infrastructure is moving utilities into a future that’s beginning to look radically different from the century-old business model


Would you like to see the latest features of SAS Enterprise Guide in action? Of course you would! That's why it's well worth the 12 minutes of your time to watch this video from SAS Global Forum 2016. In the video, Casey Smith (SAS' R&D manager of the SAS Enterprise


More and more organizations are considering the use of maturing scalable computing environments like Hadoop as part of their enterprise data management, processing and analytics infrastructure. But there's a significant difference between the evaluation phase of technology adoption and its subsequent production phase. This seems apparent in terms of how organizations are
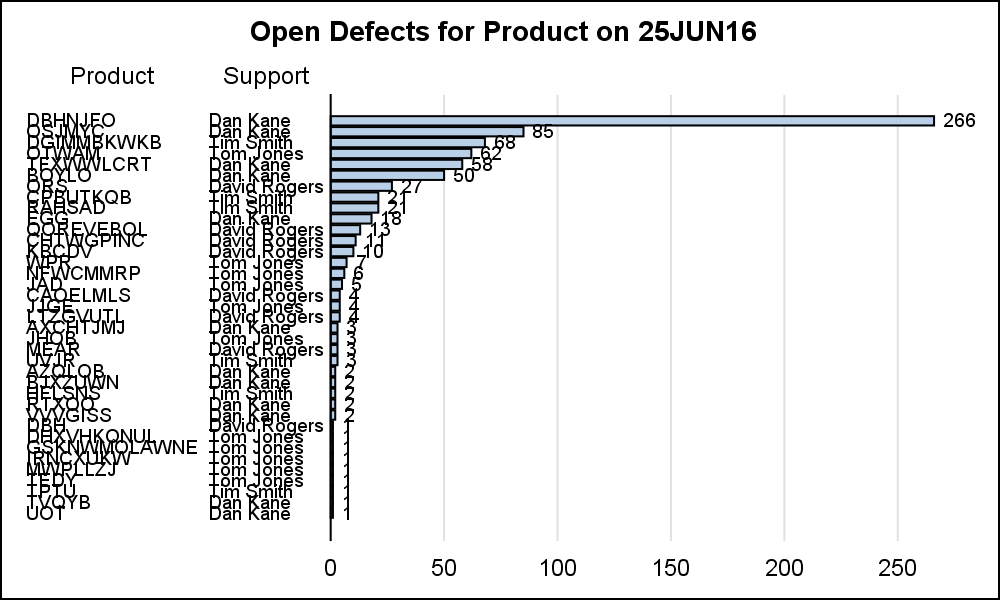
Recently, I needed to view the list of products with the highest number of defects. I have a data set of defects reported against various products. The data set has over 30 products, and each observation contains the product name, name of the primary support person, and other relevant details of