All Posts

As technology expands, we have a similarly increasing need to create programs that can be handed off – to clients, to regulatory agencies, to parent companies, or to other projects – and handed off with little or no modification needed by the recipient. Minimizing modification by the recipient often requires
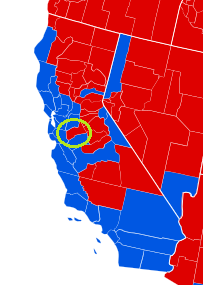

Parents are always proud of their kids, and think their kids are better than all the other kids. I guess it might be a little bit that way with mapping software ... but I really do think I've got a pretty compelling example to show that SAS maps are better


@philsimon says that it's downright silly to ignore the benefits of thinking about data-related issues in different and unexpected ways.


If you’ve worked hard to reduce added sugars in your eating plan, the looming holiday sugar fest can send shivers down your spine. It’s not visions of sugar plums causing concern; it’s the fear of turning into the blueberry girl from Charlie and the Chocolate Factory!
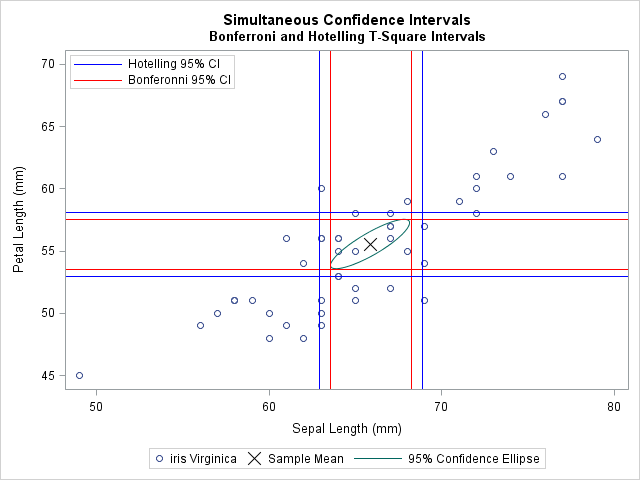

Many SAS procedure compute statistics and also compute confidence intervals for the associated parameters. For example, PROC MEANS can compute the estimate of a univariate mean, and you can use the CLM option to get a confidence interval for the population mean. Many parametric regression procedures (such as PROC GLM)


As technology evolves, so do the c-suite roles related to technology. In particular, the roles of Chief Digital Officer and Chief Data Officer – both referred to as CDO – have seen rapid changes. This post will document the changes I've observed in these two roles, and answer questions I've heard as our customers have been navigating the
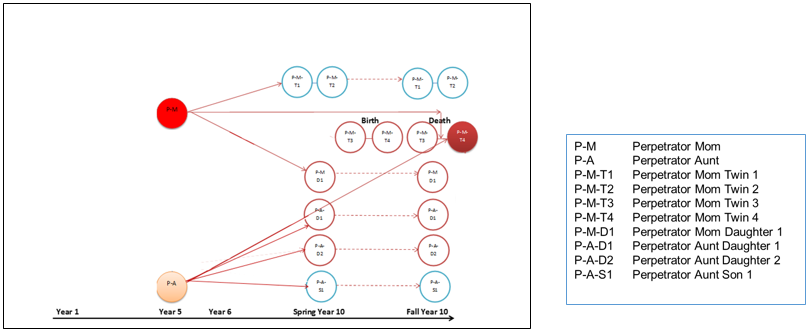

When protecting children, “entity resolution” can reduce the things agencies don’t know they don’t know. It’s a technological capability I wish I’d had when I led a child protective services agency. I have been involved in hundreds of determinations that would alter a child’s life trajectory. I was comfortable with


The cybersecurity challenge exemplifies how global threats have evolved and how governments must combat them. For all the complexity of the Cold War, the United States defense officials knew the nations that posed the biggest threat. The world is much different today. As General Michael Hayden (ret.), former Director of the National Security


Winter holiday traditions and family rituals are the stuff of rich memories for many grown kids like myself. As a parent educator, I also know that traditions can benefit all members of the household: The repetitive nature of traditions contributes to a sense of comfort and belonging. Traditions can help


Index of articles on "Getting Started with SGPLOT Procedure". Getting Started with SGPLOT - Part 1 - Scatter Plot. Getting Started with SGPLOT - Part 2 - VBAR. Getting Started with SGPLOT - Part 3 - VBOX. Getting Started with SGPLOT - Part 4 - Series Plot. Getting Started with


Data quality initiatives challenge organizations because the discipline encompasses so many issues, approaches and tools. Across the board, there are four main activity areas – or pillars – that underlie any successful data quality initiative. Let’s look at what each pillar means, then consider the benefits SAS Data Management brings


Editor's note: This series of blogs addresses the questions we are most frequently asked at SAS Press! Ever thought about writing your own SAS or JMP book? Here are a few reasons why writing a SAS Press book can be a fantastic career move! 1. Your book establishes you as
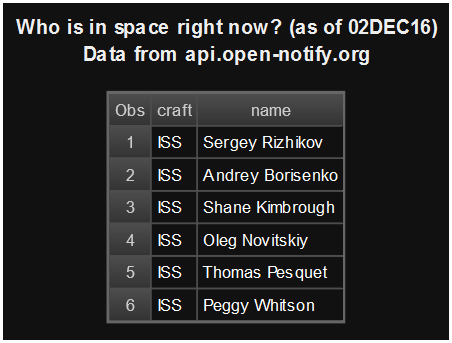

JSON is the new XML. The number of SAS users who need to access JSON data has skyrocketed, thanks mainly to the proliferation of REST-based APIs and web services. Because JSON is structured data in text format, we've been able to offer simple parsing techniques that use DATA step and


Data integration helps a successful business make things simple and quick for customers, and keeps them coming back. While a company will have data silos, data held within one area is made available to others in order to help the customer. In most local, county and state governments that is


Traditional data management includes all the disciplines required to manage data resources. More specifically, data management usually includes: Architectures that encompass data, process and infrastructure. Policies and governance surrounding data privacy, data quality and data usage. Procedures that manage a data life cycle from creation of the data to sunset