All Posts
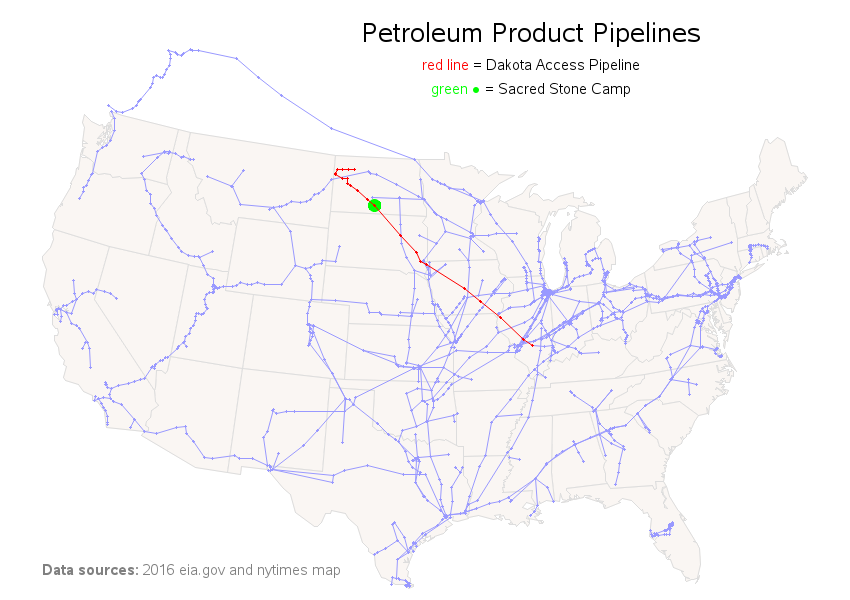

You've probably seen dramatic pictures in the news lately about the protests against the Dakota Access Pipeline - Native Americans versus bulldozers, protesters and tipis in a blizzard, and things like that. But do you really know much about this pipeline? For example, where will it go, and where have the
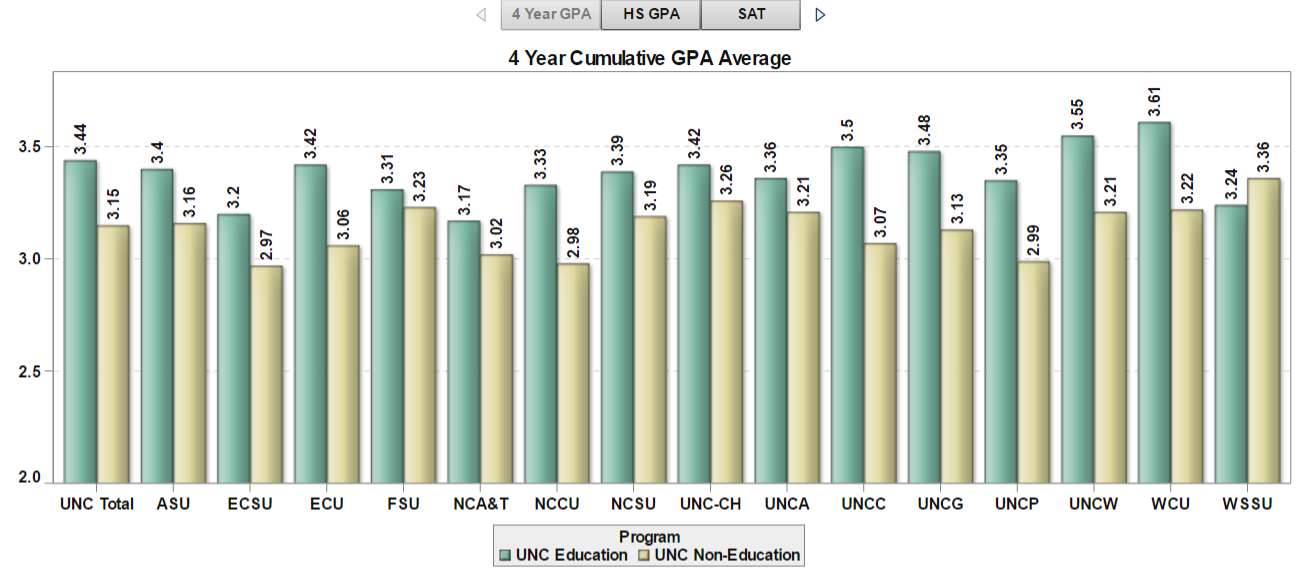

With educator preparation programs (EPPs) under fire, states must make difficult decisions on how to hold EPPs accountable, provide information for program improvement, and offer consumer information to the public on EPP efficacy. In conversations I’ve had with state leaders grappling with this issue, I have seen a debate arise


Historically, before data was managed it was moved to a central location. For a long time that central location was the staging area for an enterprise data warehouse (EDW). While EDWs and their staging areas are still in use – especially for structured, transactional and internally generated data – big
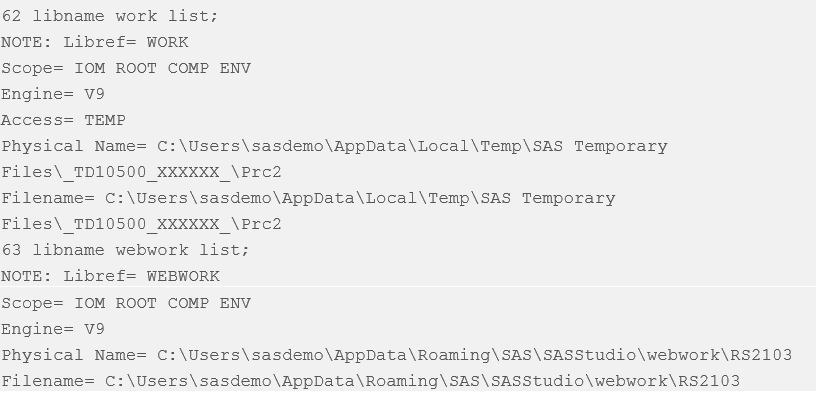

In a previous blog about SAS Studio I’ve briefly introduced the concept of using the Webwork library instead of the default Work. I also suggested, in SAS Global Forum 2016 paper, Deep Dive with SAS Studio into SAS Grid Manager 9.4, to save intermediate results in the Webwork library, because


Being an industry disruptor is a lonely place to be – but if you’re successful, the rewards are well worth the initial risk. Betting big on your new way of doing things takes courage, and is only the first step in a risky process. Your next critical step is to


Browsing on the web, I ran into a simple but visually interesting graph of financial data. Really, it could be any data, but this one showed up under "Financial Graphs". I thought this would give me an opportunity to speak about an interesting new feature added to SERIES plot with


Cotidianamente las empresas se enfrentan a la toma de vitales decisiones de negocio, desgraciadamente muchas de ellas se ven en la necesidad de hacerlo sin la certeza que éstas sean idóneas, ya que el panorama en el que deben analizar no es totalmente claro. Esta toma de decisiones ciegas tienen
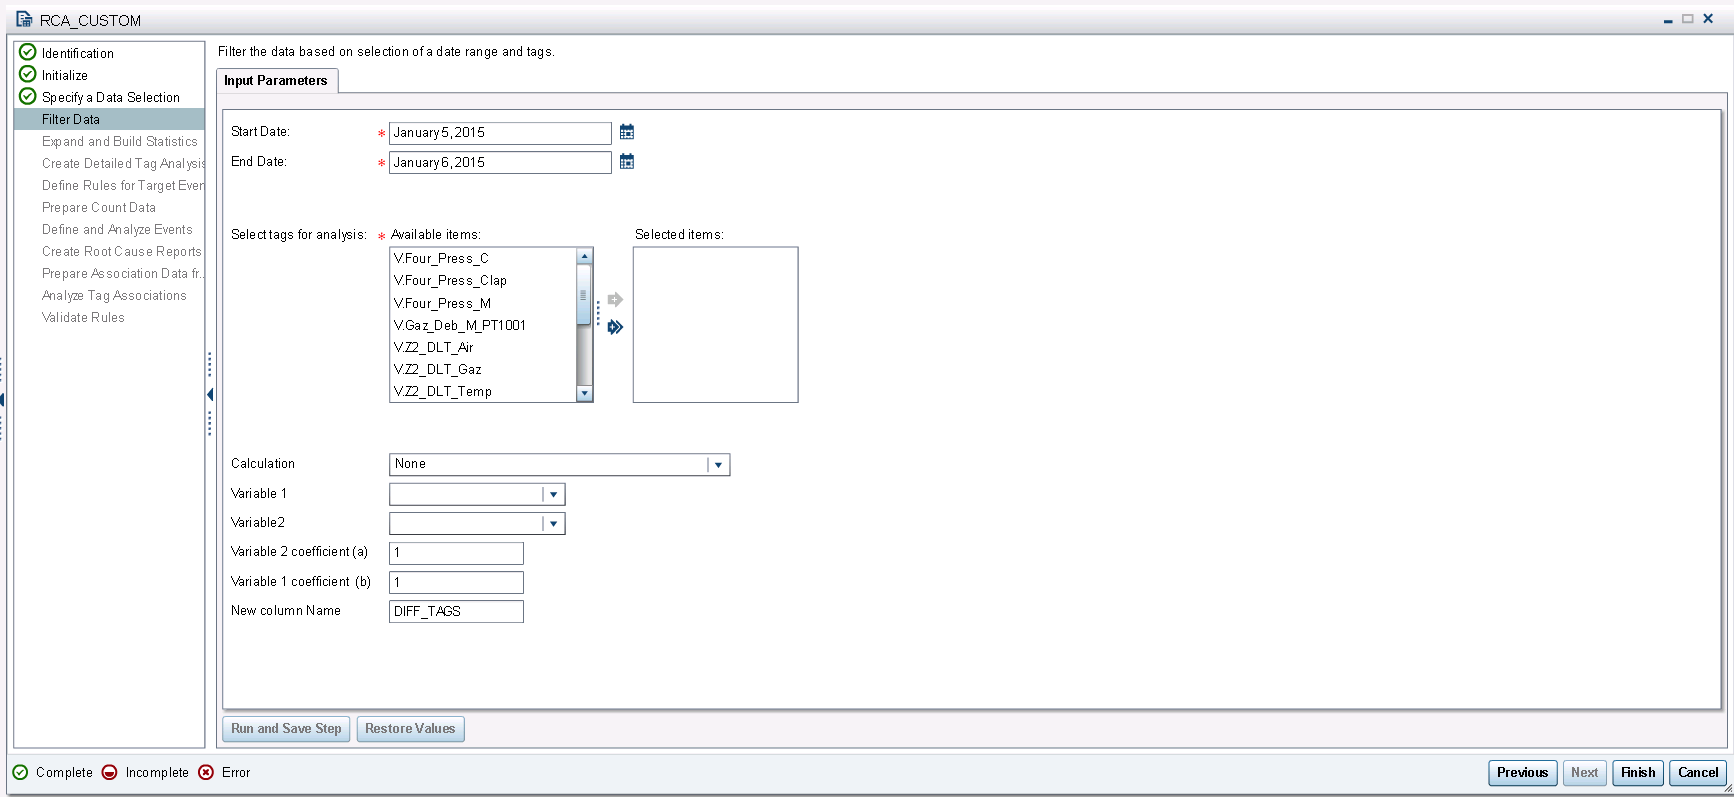

During a recent customer visit, I was asked how to include a calculated variable within SAS Asset Performance Analytics’ (APA) Root Cause Analysis workflow. This is a simple request. Is there a simple approach to do this? To remind you, in the APA workflow, an ETL Administrator makes a Data
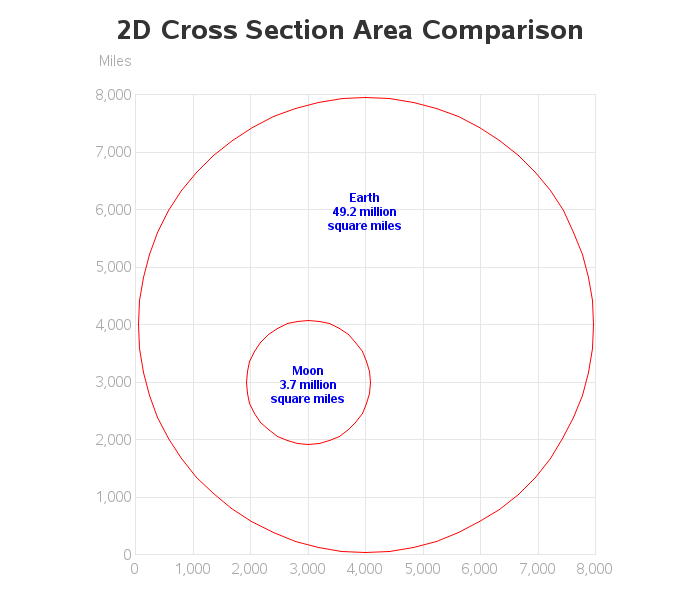
Are you ready for the supermoon on December 14? This will actually be the 3rd supermoon in 2016! With these big-looking full moons we're having this year, I got to wondering exactly how big is the moon compared to Earth? This seems like a good question to answer with some


It's that festive time of year again, so you may want to build yourself a fire and grab a cup of hot chocolate as you prepare for a rousing round of holiday/IT joy. Grab your co-workers and gather around the water cooler while singing along to this post and others


In the first blog of this four-part series, we discussed traditional data management and how we can apply these principles to our big data platforms. We also discussed how metadata can help bridge the gap of understanding the data as we move to newer technologies. Part 2 will focus on


Strengthens core. Opens hips, psoas, shoulders, chest and back. Also aids in digestion. One-Legged King Pigeon Pose (Sanskrit: Eka Pada Rajakapotasana)

This is the 3rd installment of the Getting Started series, and the audience is the user who is new to the SG Procedures. Experienced users may also find some useful nuggets here. The Tukey box plot is popular among statisticians for viewing the distribution of an analysis variable with or without


This student projections post kicks off a series highlighting education leaders sharing the celebrations, and challenges, of using data to drive school improvement. These are real teachers, principals and superintendents working to foster academic growth for every student in their schools and districts. As we near the end of the first

Dentro de toda compañía la búsqueda del éxito es una constante, sin embargo, para alcanzarlo el primer paso es minimizar y de ser posible desaparecer todos los factores de riesgo que puedan ponerlo en peligro, por ejemplo, el fraude. Diversos son los factores que pueden dar paso a la presencia