During a recent customer visit, I was asked how to include a calculated variable within SAS Asset Performance Analytics’ (APA) Root Cause Analysis workflow. This is a simple request. Is there a simple approach to do this?
To remind you, in the APA workflow, an ETL Administrator makes a Data Mart available in the solution for the APA users. They can select variables and explore, analyze and create a model based on the columns present in the Data Mart.
But if you want to analyze a calculated column, like a difference between two variables, do you need to change the Data Mart? Yes, if you want the APA Data Selection to include this calculated column. But this takes time, and do you really need to change the Data Mart? No!
A simpler and faster approach to adding a calculated column is modifying the APA Root Cause Analysis workflow. And, this is simple!
SAS Asset Performance Analytics is easily and highly configurable. You can easily customize analytical workflows by modifying its underlying stored process. Let me show you how to customize an existing analysis and add a calculation step to enhance APA’s Root Cause Analysis with a calculated column.
Benefits
The main purpose of this customized analysis is to avoid the SAS Enterprise Guide utilization. The users are rarely SAS experts. Thereby, asking users to switch between the tools depending on the functionalities availability on the APA GUI isn’t recommended. The more you can do within the APA interface via wizard-guided workflows, the easier it will be.
The second benefit is the keeping the Data Mart limited to only crucial variables. Instead of asking an ETL Administrator to add non-validated and/or infrequently used calculated columns to the Data Mart, allow the APA user to test and create meaningful tags to enhance workflows as needed. Once the APA user identifies new and meaningful calculated variables, they can easily be added to the Data Mart and available to APA Explorations and APA Stability Monitoring. Limiting only critical variables within the Data Mart will ensure the data size is optimizing and only adjusted as needed.
Root Cause Analysis Use
The use of this new Root Cause Analysis is very easy, instead of selecting “Root Cause Analysis,” select “Root Cause Analysis Calculated Columns” when required.
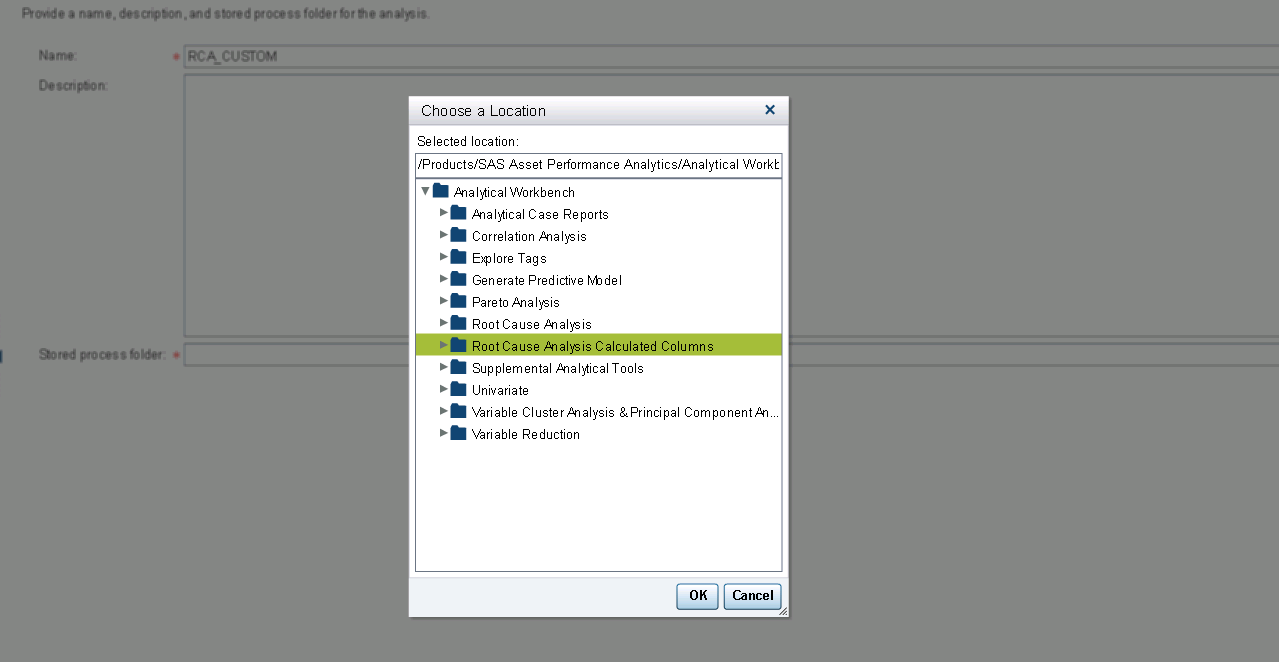
Clicking on “Ok” triggers the same steps as the original RCA.
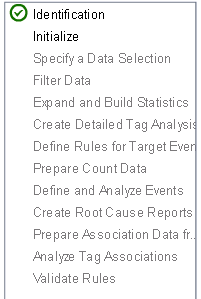
After specifying a data selection, the “Filter Data” step contains six new user prompts:
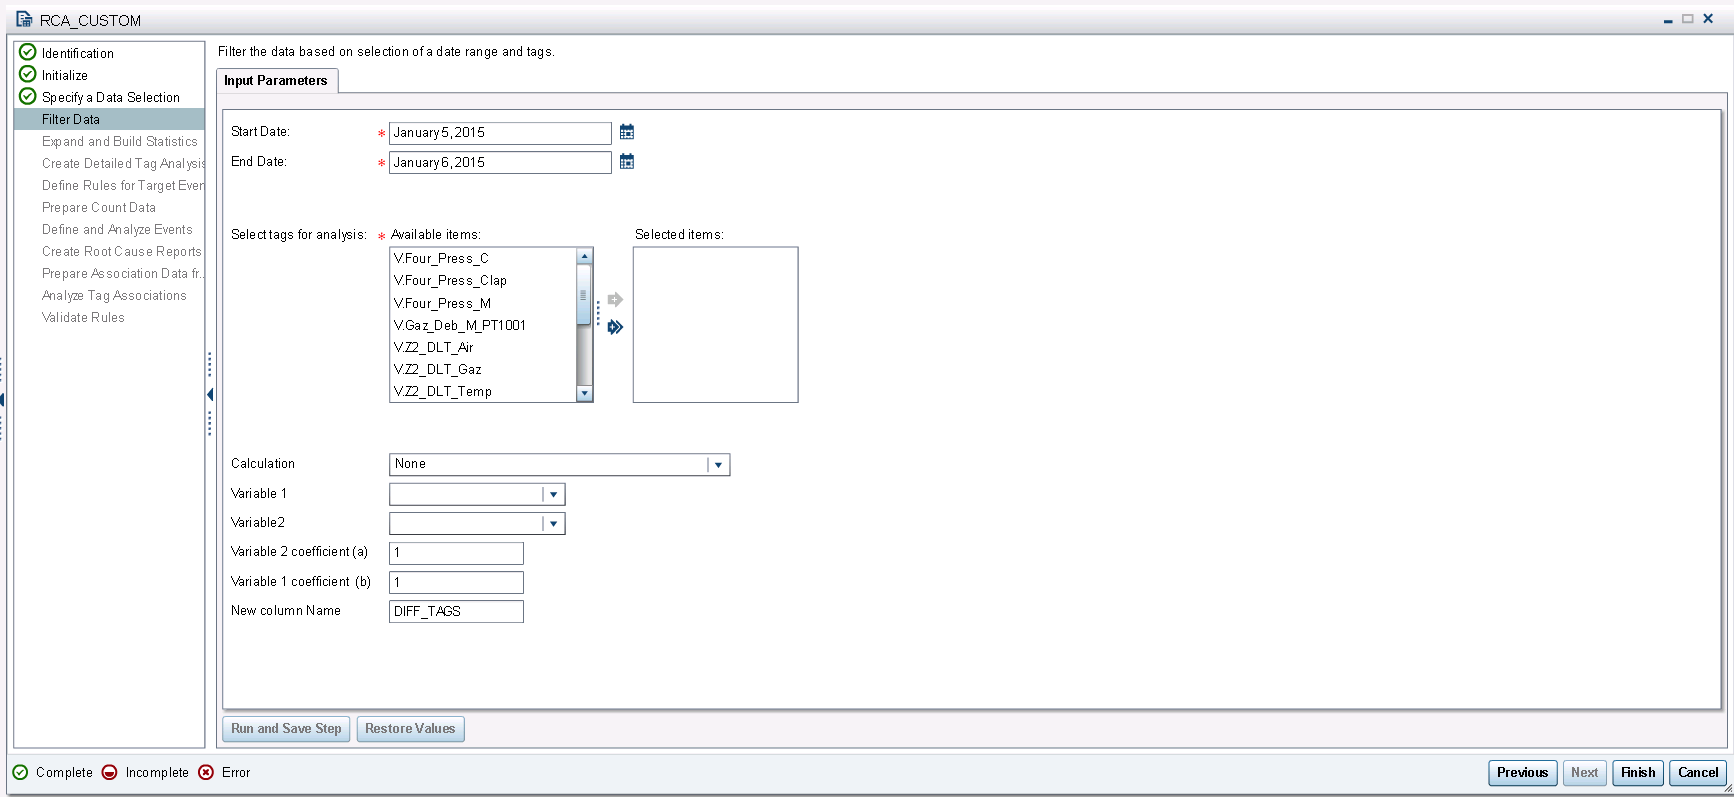
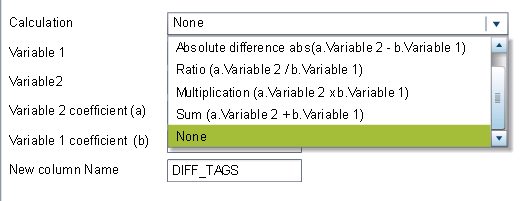
These prompts allow the user to define what calculation is needed. Six calculations choices are currently available. These choices can be further customized as needed. Calculations types currently available include:
- Difference between two variables if you want to study a gap between two tags
- Absolute difference of two variables if large gaps are suspicious regardless of the order
- Ratio of two variables if you want to control the proportionality
- Multiplication of two variables
- Summation of two variables
- None
By default, the Calculation option is set to “None,” to perform a classical Root Cause Analysis.
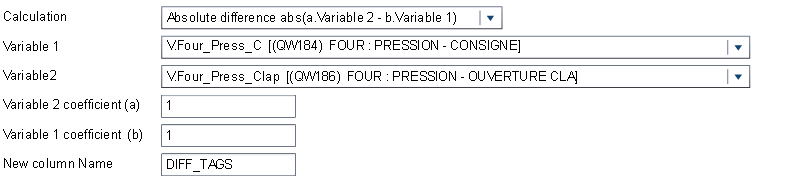
After choosing your variables, you can apply variable coefficients you want to test. By default, APA performs an absolute difference Variable 1 – Variable 2, with the coefficients set to 1. If the variables don’t have the same order of magnitude, you can apply a coefficient to put the variables at the same level. By doing this the newly created calculated variable fluctuates around 0, which is easily interpretable.
In the example below, the goal is to realize a simple absolute difference between the Variable 2 (V.Four_Press_Clap) and the Variable 1 (V.Four_Press_C). By default the newly created column name is DIFF_TAGS. You can modify it to something more descriptive for your purposes. Don’t forget that the new column name must follow standard SAS column naming conventions.
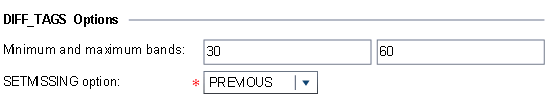
Before processing the step, be careful to check the data is not missing during the data period you’ve selected. If it’s missing during the full time period, the DIFF_TAGS variable will not be created and the output will be the same than if you’d selected “None” for the calculation prompt.
Click “Run and Save Step.” As a result, the newly created calculated column is added to your input RCA data and available in the “Expand and Build Statistics” step. Now you can apply minimum and maximum value bands to the calculated column similar to the original RCA workflow.
As a result, the calculated column is used like a standard input tag during the full Root Cause Analysis workflow.
Things to keep in mind
If you have a specific need, SAS Asset Performance Analytics is easily customizable. In France, for example, we propose an unlimited and modular APA interface.
Creating columns within the APA user interface analysis workflow has two main benefits:
- The calculation is intuitive for a non SAS user
- You don’t need to change the data mart
Only two steps are required to implement Root Cause Analysis including Calculated Columns within APA:
- Copy and paste the pam_rca_filterData_NEW.sas file in the SASHome/SASFoundation/ 9.4/pamsrmv/sasstp directory.
- Using the SAS Management Console, import the RCA_CC.spk file at the following location: /Products/SAS Asset Performance Analytics/Analytical Workbench in the Folders tab.
If you have any questions about this process, feel free to add a comment below.

3 Comments
Good job! Thanks for SAS usées
Well done John. Very helpful with a business focus !
Good job! Clear and helpful.