With educator preparation programs (EPPs) under fire, states must make difficult decisions on how to hold EPPs accountable, provide information for program improvement, and offer consumer information to the public on EPP efficacy. In conversations I’ve had with state leaders grappling with this issue, I have seen a debate arise over the best way to provide this information. The debate is over dashboard versus scorecard.
Should states simply provide a variety of information on the programs or should that information be weighted and programs be ranked or assigned an effectiveness value? Below we will explore two states’, North Carolina’s and Delaware’s, approaches in developing these systems.
EPP Dashboards: The University of North Carolina System
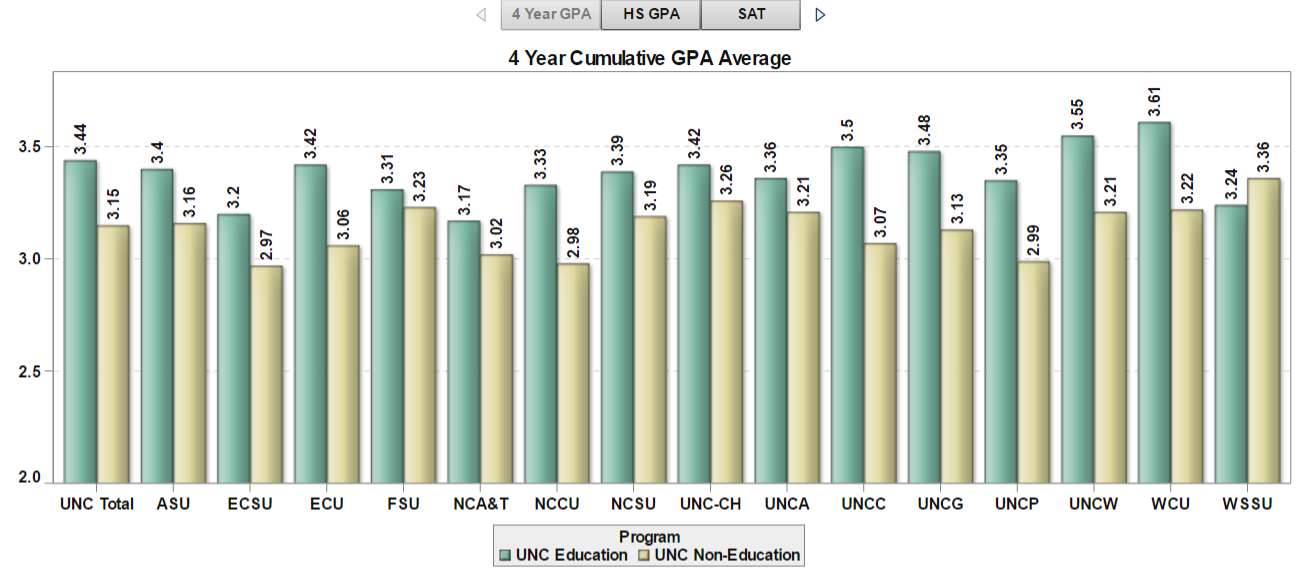
Advocates for the dashboard approach suggest that states provide a variety of information on EPPs from demographic information, licensure passage rates, placement and retention information, to student outcome information. This information can be used for consumer information, program improvement, or accountability. All of the indicators that are selected are presented as equal levels of information about the program. There are no weighting systems for each of the indicators or ranking system across programs or providers.
The University of North Carolina system developed a dashboard-type system and continues to add more metrics annually. Currently, the UNC Educator Quality Dashboard contains information on things such as enrollment trends, teacher productivity, time to degree and student growth data for recent completers. The state is currently working on adding additional information on the clinical experience candidates have prior to completion.
EPP Scorecards: Delaware
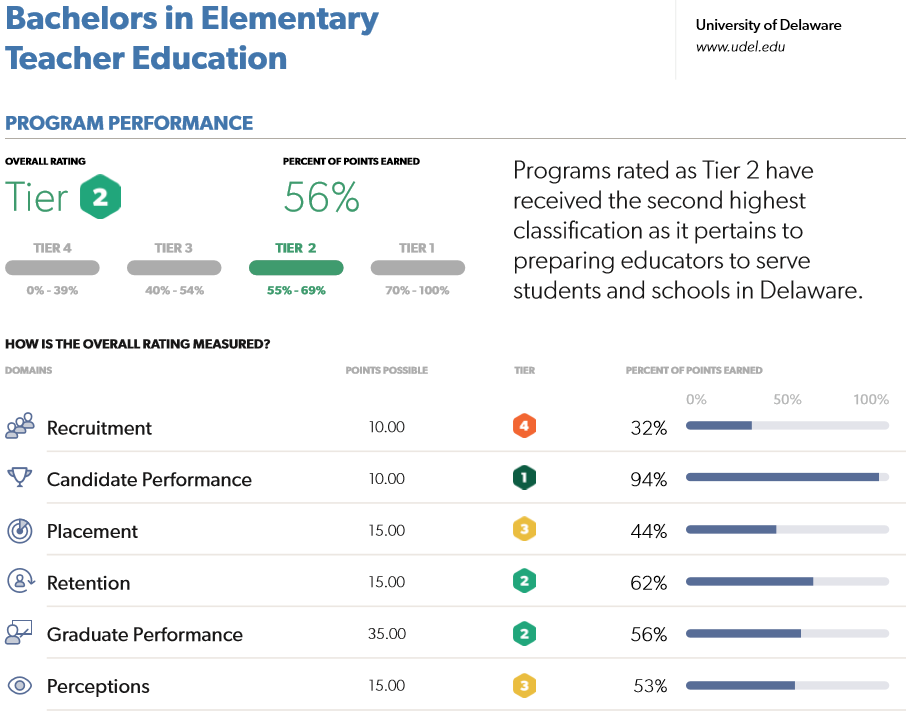
States choosing to use a scorecard approach select a variety of metrics and provide a weighting system or ranking system for those metrics. For instance, the Delaware Educator Preparation Program Reports include information on six scored domains: recruitment, candidate performance, placement, retention, graduate performance, and perceptions. Each of these domains are assigned a score and then a summative performance rating places each program in a performance tier. Systems such as Delaware’s allows states to place a value on specific characteristics of programs such as candidate performance in the classroom or candidate diversity.
Each of these systems have various strengths and weaknesses. States will need to explore the different options of not only the indicators used in educator preparation reporting but also the purpose of that reporting and the values their state will assign to the metrics.