All Posts


We’ve become a lower carb household in the past few years due to family health history and genetics that strongly encourage it. As a result, our decades-old breakfast of eating cereal with milk went out with the trash leaving the challenge of finding low carb, nutrient-dense options.
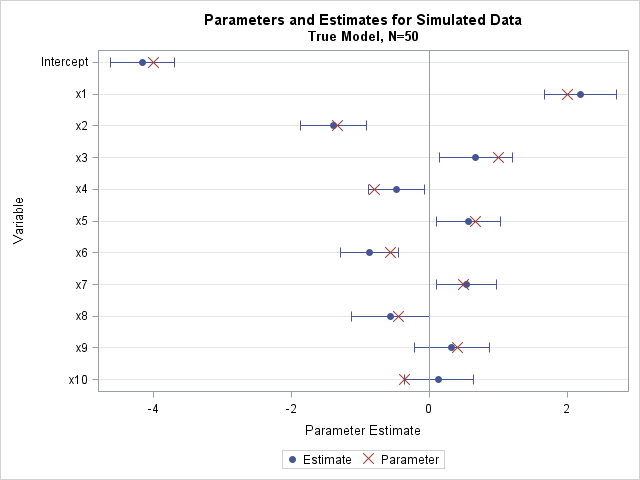

This article shows how to simulate a data set in SAS that satisfies a least squares regression model for continuous variables. When you simulate to create "synthetic" (or "fake") data, you (the programmer) control the true parameter values, the form of the model, the sample size, and magnitude of the


Editor's note (10/25/17): You can practice what you learned in class with 15 hours of Free virtual lab time when you attend the in-person or Live Web Applied Analytics Using SAS Enterprise Miner class. Register now. Are you interested in taking an advanced course on the machine learning topic of Neural Networks? Does text


Historically, tax havens have been a key tool for tax evaders to store and hide unreported and untaxed money. I would agree with most observers that the Panama papers (11.5 million leaked documents that detail financial information for more than 214,488 offshore entities) are just the tip of the tax


In a previous blog, Random Sampling: What's Efficient?, I discussed the efficiency of various techniques for selecting a simple random sample from a large SAS dataset. PROC SURVEYSELECT easily does the job: proc surveyselect data=large out=sample method=srs /* simple random sample */ rate=.01; /* 1% sample rate */ run; Note:

We are a few months away from SAS Global Forum in Orlando. You might think that the conference kicks off Sunday night at opening session, but there are plenty of weekend activities before then and I’d like to highlight one of them: SAS certification exam sessions. Isn’t now a great
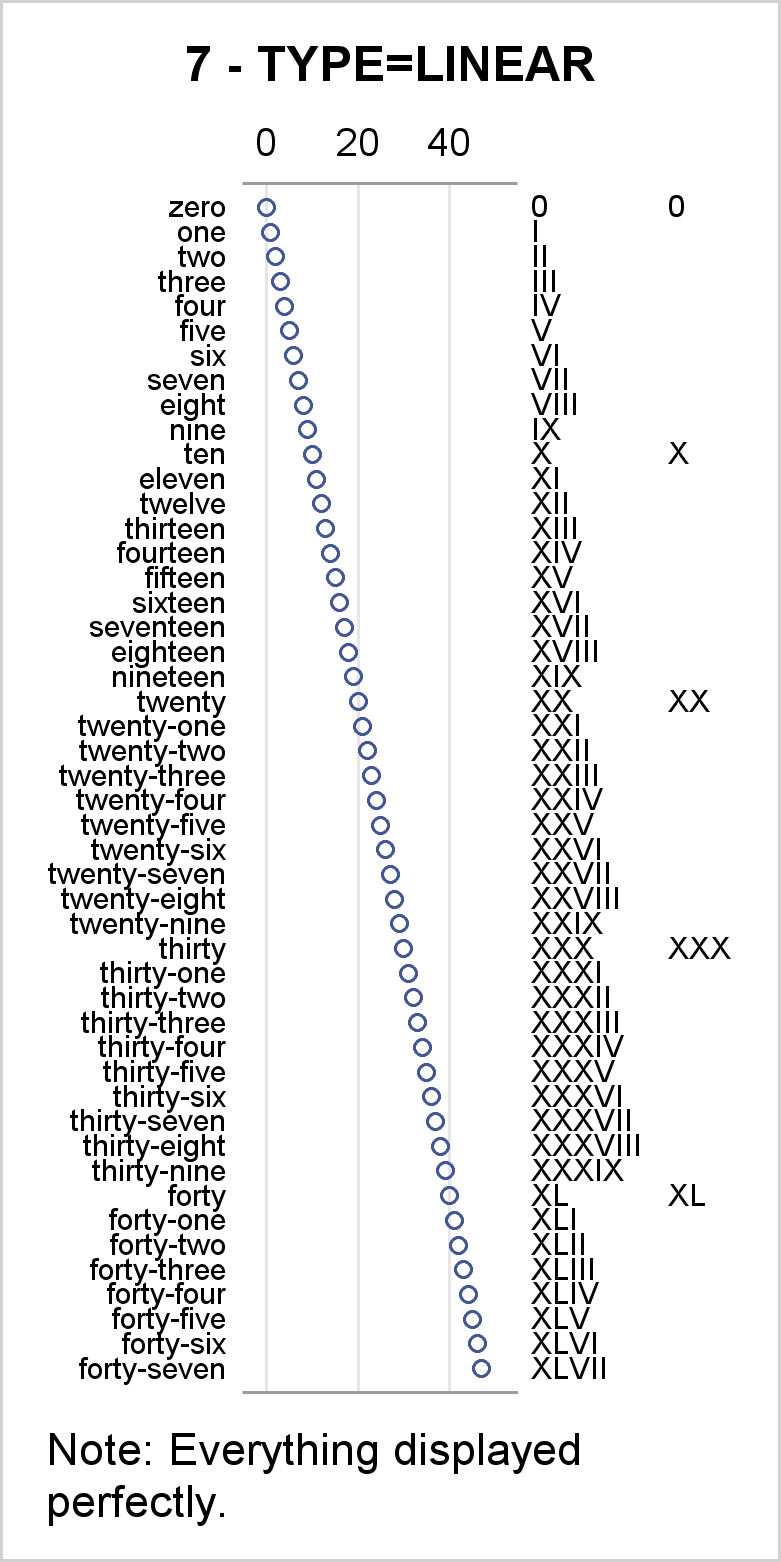

I review some fundamental principles of creating axis tables along with graphs that have TYPE=LINEAR or TYPE=DISCRETE axes.
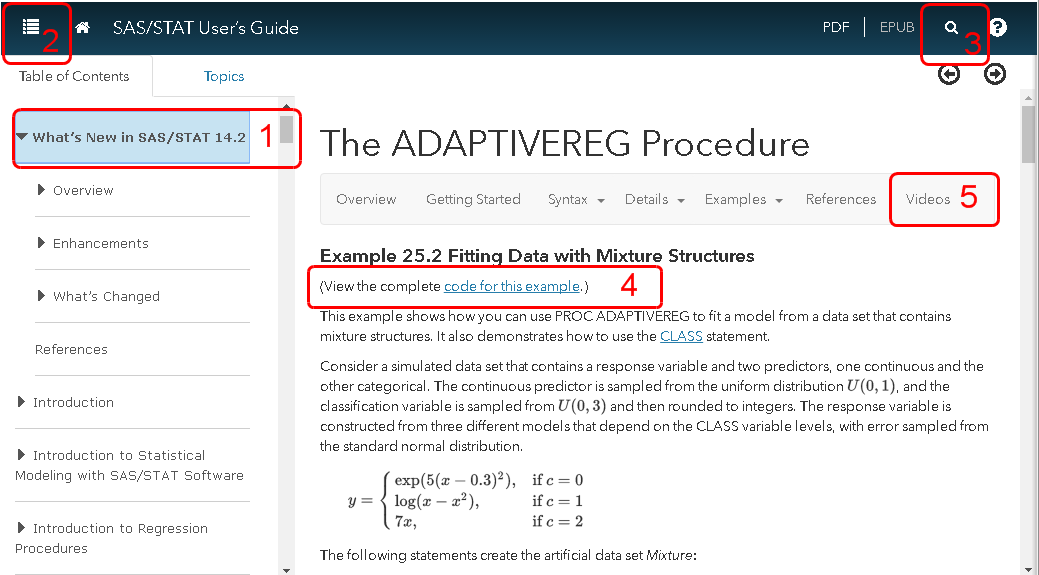
The SAS analytical documentation has a new look. Beginning with the 14.2 release of the SAS analytical products (which shipped with SAS 9.4m4 in November 2016), the HTML version of the online documentation has moved to a new framework called the Help Center. The URL for the online documentation is
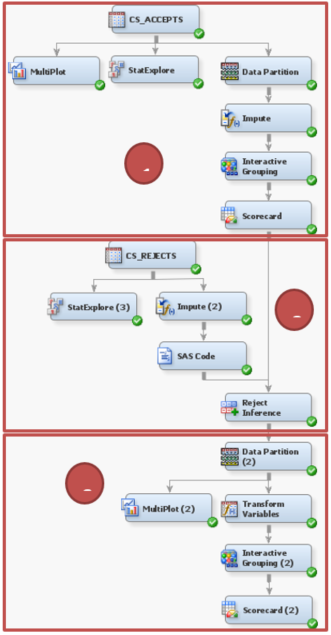

Editor's note: The following post is from Xiaoyuan Zhang, presenter at an upcoming Insurance and Finance User Group (IFSUG) webinar. Learn more about Xiaoyuan Zhang. As a business user with limited statistical skills, I don’t think I could build a credit scorecard without the help of SAS Enterprise Miner. As you


I remember my grandparents talking about how hard things were for them growing up. They would say, “Things were so bad that we had to walk uphill, both ways, in the freezing snow to get to school.” It was always hard for me to relate to these statements because the
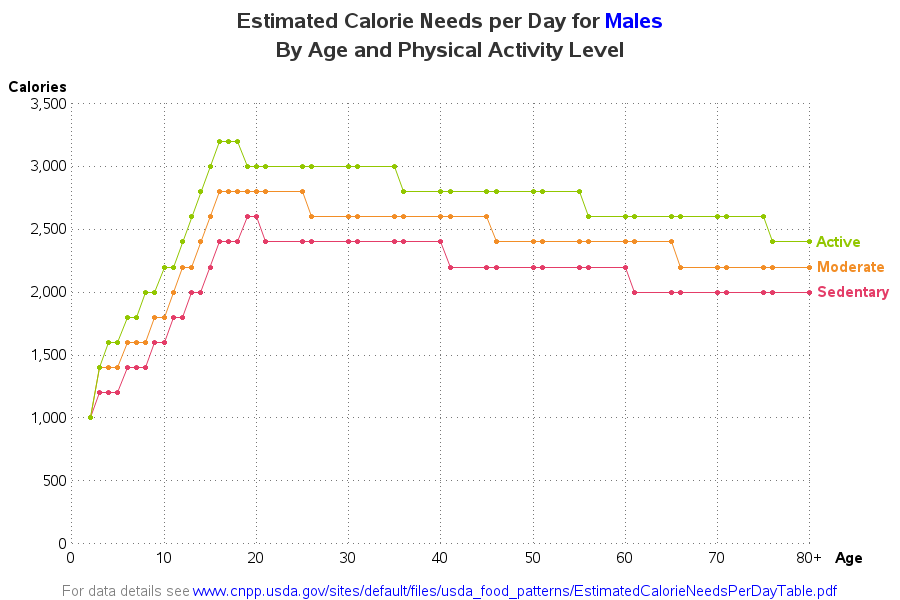

"They'll eat you out of house & home! Their food bill will put you in the poor house! ... And they never gain an ounce!" - That's what my friends say about their teenage sons. They're probably exaggerating a little, but since it's a recurring theme, there's probably some truth


As the application stack supporting big data has matured, it has demonstrated the feasibility of ingesting, persisting and analyzing potentially massive data sets that originate both within and outside of conventional enterprise boundaries. But what does this mean from a data governance perspective?

This predictive analytics post continues a blog series that highlights education leaders sharing successes and challenges of using data to drive school improvement. Sampson County Schools is a small rural school district in southeastern North Carolina. While overall graduation rates in the county were improving, one school wanted to do


It's the 3rd week of January. Did you set a fitness resolution or a 2017 exercise goal? How are you doing? Usually week 3 is where things start getting real. And by real, I mean real hard. The sparkle of newness wears off, enthusiasm wanes, the gym is crowded, and
Here in the US, it's Girl Scout cookie season. This is when you get to spend a few bucks on cookies, break your New Year's resolution about losing weight ... and feel good about it, because the money's going to a good cause. Or is it? - Let's break down