All Posts

The full text of Fermat's statement, written in Latin, reads "Cubum autem in duos cubos, aut quadrato-quadratum in duos quadrato-quadratos, et generaliter nullam in infinitum ultra quadratum potestatem in duos eiusdem nominis fas est dividere cuius rei demonstrationem mirabilem sane detexi. Hanc marginis exiguitas non caperet." The English translation is:

The 2017 edition of SAS Global Forum, the largest annual SAS user group meeting, will be held at the Swan and Dolphin Resort in Orlando, Florida on April 2-5. Among the many analytic talks at SAS Global Forum 2017, several focus on operations research topics like optimization and simulation. If

There's an old song that starts out, "You Can Get Anything You Want at Alice's Restaurant." Well, maybe you are too young to know that song, but if you’re a SAS users, you’ll be glad to know that you can capture anything produced by any SAS procedure (even if the


In honor of March Madness, the RFC hosted our first March Mania Challenge led by our Fearless Trainer, Angie Fernandez. Team Captains gathered, or in my team’s case, conjured might be a better word ;), a group of five SAS Employees. Our task was to compete in dedicated Mania exercises consisting


Durante el Omnichannel Analytics Forum, Dan Mitchell, Director de la Práctica de Negocio Retail en SAS, compartió con la audiencia cómo la industria minorista se ha consolidado y enfrentado a un ambiente volátil, dando como resultado la búsqueda de nuevas formas de acercamiento con el cliente. “La ejecución omnicanal es

March Madness is in full swing. And the success of the Dance Card formula powered by SAS -- along with stories about teams like the New York Mets, the Boston Bruins, the Orlando Magic and more, all using analytics -- demonstrates how sports and analytics are becoming more and more
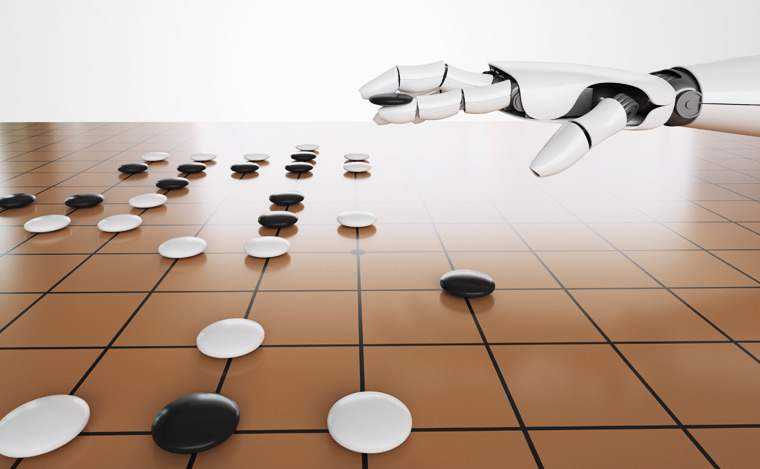

인공지능 vs. 인간, 세기의 대결 이후 1년 전 세계가 주목했던 인공지능(AI)과 인간의 바둑 승부! 인공지능의 놀라운 가능성을 확인했던 세기의 대결 이후 벌써 1년이 지났습니다. 그렇지만 인공지능에 대한 관심은 여전히 뜨거운데요. 이제 머신러닝과 딥러닝까지 가세해 대기업은 물론 스타트업과 벤처캐피탈 그리고 정부 정책에 이르기까지 글로벌 이슈를 이끌고 있습니다. 실제 구글, 마이크로소프트, 아마존,

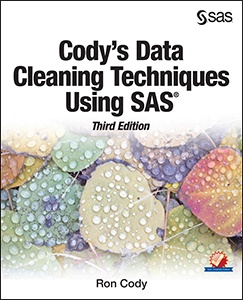
If you're into data visualization, here's something that might interest you - a free eBook showing several ways to use SAS to visually analyze your data. (Did I mention it's FREE?!?!) We've picked juicy chapters from several books and upcoming books (and a few other sources), to show you what


제조 업체들은 정치, 경제, 재무, 경쟁사 등 다양한 당면 과제 속에서 비즈니스를 운영하고 있습니다. 앞으로의 제조 환경도 글로벌 경제 위기 때만큼이나 불확실해 보이는데요. 그렇지만 제조업의 성장 기회는 분명 있을 것입니다. 최근 제조 산업에는 ‘인더스트리 4.0’이라는 새로운 시대의 막이 오르고 있습니다. 새 시대에는 자동화, 대규모 데이터, 분석이 사물인터넷(IoT), 클라우드 컴퓨팅과 융합하고, 가상 및


@philsimon says that old stalwarts sometimes just don't cut it.

뉴욕 주 금융 당국(NYDFS), 금융 사이버 보안 규정 발표 최근 미 뉴욕 주 금융서비스국(NYDFS)은 뉴욕의 은행, 보험사, 기타 금융 기관을 대상으로 새로운 사이버 보안 규정을 발표했습니다. 2017년 3월 1일부터 효력을 발휘한 이 규정은 소비자와 금융 서비스 산업 전체를 보호할 사이버 보안 프로그램의 개발과 유지를 골자로 합니다. 이 사이버 보안 지침은 2016년 9월
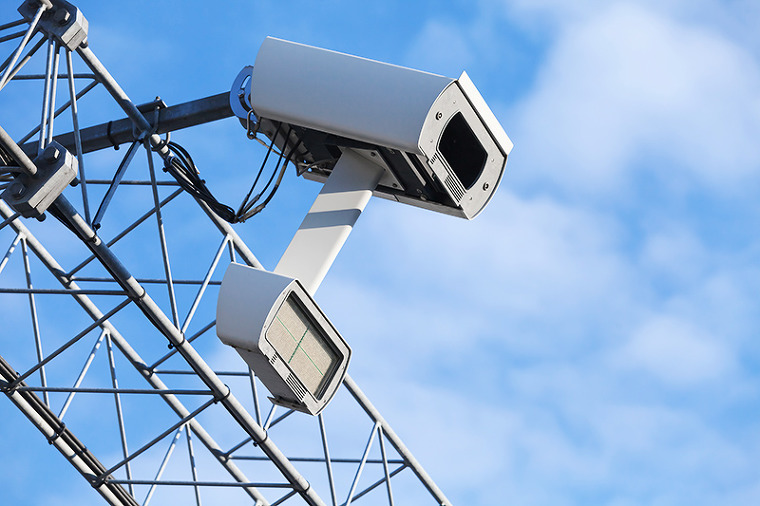
스티븐 스필버그 감독과 톰 크루즈 주연의 영화 ‘마이너리티 리포트’는 예술적 측면뿐 아니라 사회적으로도 다양한 이슈를 만들었습니다. 톰 크루즈가 맡은 주인공 존 앤더튼은 도시 곳곳에 설치돼 신원을 확인하는 홍채 인식 시스템으로부터 숨기 위해 안구 이식 수술을 받는데요. 영화와 달리 안구 이식 수술은 현실에서 아직 가야 할 길이 멉니다. 하지만 ‘편재형 개인
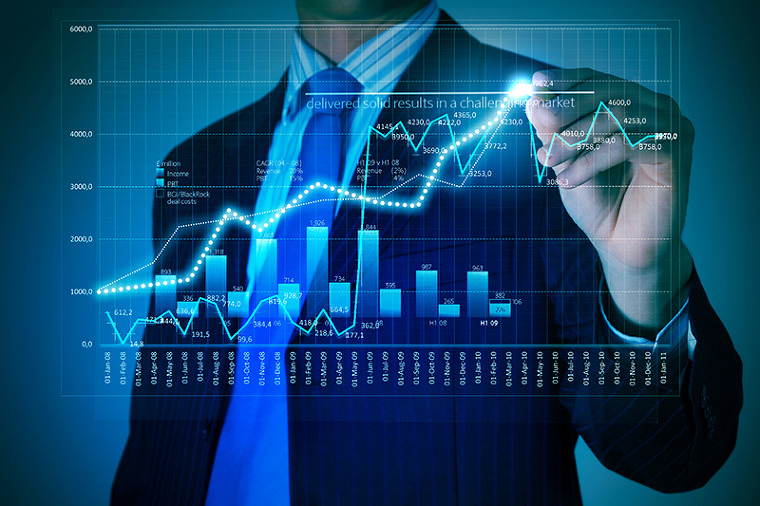
데이터 사이언스와 데이터 사이언티스트에 대한 설전과 토론이 맹렬한 가운데 여러 기업들이 다수의 데이터 사이언티스트 채용 및 고용에 적극적으로 나서면서 데이터 사이언티스트에 대한 수요가 실제 취업 예정자 공급을 추월하기 시작했습니다. 이로 인해 데이터 사이언티스트의 효과적인 유치 및 유지라는 화두 역시 IT 및 비즈니스 커뮤니티에서 뜨거운 감자로 떠올랐습니다. 이러한 상승세에서 기업은 모두가 탐내는
미국의 최고 권위의 과학자인 버니바 부시(Vannevar Bush)가 기계가 생각하고 학습하는 미래를 예측한 것이 1945년이었습니다. 당시까지만 해도 과학적 공상으로만 보였던 것이 이제는 Google 검색 결과 같이 평범한 사물까지도 머신러닝의 산물이 되고 있습니다. 넷플릭스(Netflix)는 머신러닝을 사용하여 개인 맞춤형 영화 추천 서비스를 제공하고 있습니다. eHarmony는 머신러닝을 통해 사랑까지 수량화하여 예측합니다. 은행들은 사이버 감시를 비롯해 사기 및 악용

온라인 활동부터 오프라인 구매 및 소셜 노출에 이르기까지 Walmart는 전 세계 어느 리테일러보다 광범위한 고객 네트워크를 자랑합니다. 글로벌 고객 인사이트 분석 부문 수석 이사인 다니엘 소프(Daniel Thorpe)에 따르면 회사의 주간 소셜 노출만 30만 건에 달한다고 합니다. 소프는 분석 팀을 이끌면서 고객 스스로 생산하는 행동 데이터를 기반으로 고객에 대한 전반적인 이해를