All Posts


During the week when everyone hanging onto their money until the last day files their taxes here in the U.S., I find it valuable to reflect on what won’t happen this week. Based on studies from the IRS, an estimated $458 Billion WON’T be appropriately reported or paid. This is
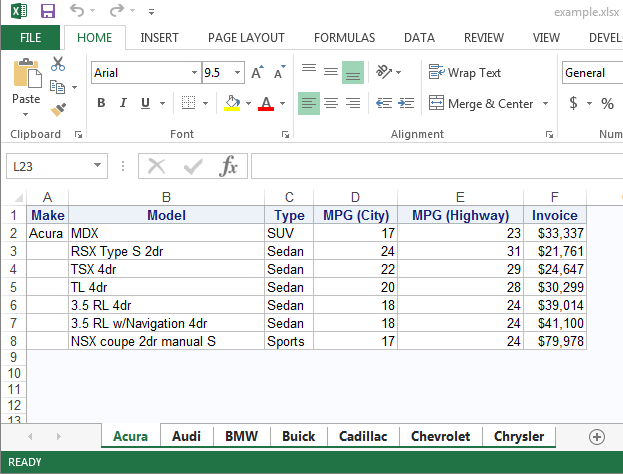

Ok, so you know how to create multiple sheets in Excel, but can anyone tell me how to control the name of the sheets when they are all created at once? In the ODS destination for Excel, the suboption SHEET_INTERVAL is set to TABLE by default. So what does that
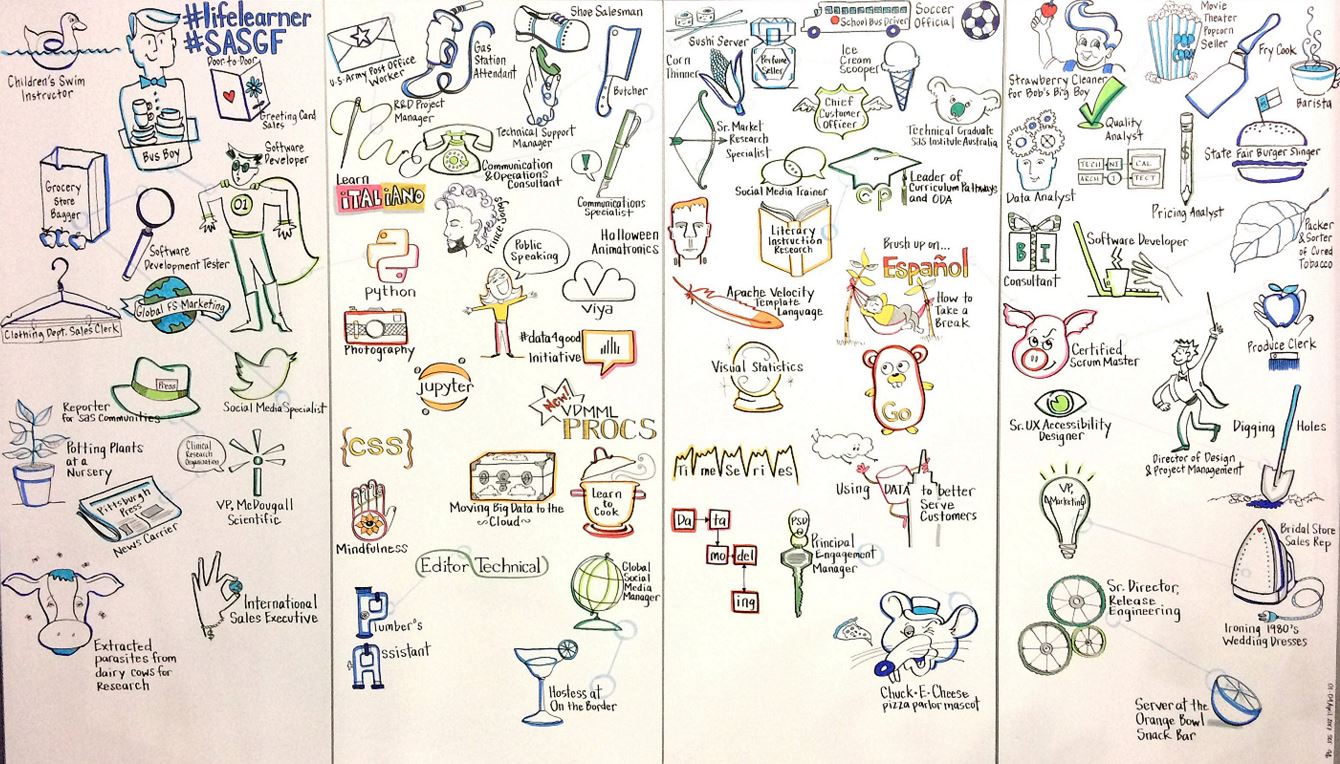

In addition to his day job as Chief Technology Officer at SAS, Oliver Schabenberger is a committed lifelong learner. During his opening remarks for the SAS Technology Connection at SAS Global Forum 2017, Schabenberger confessed to having a persistent nervous curiosity, and insisted that he’s “learning every day.” And, he
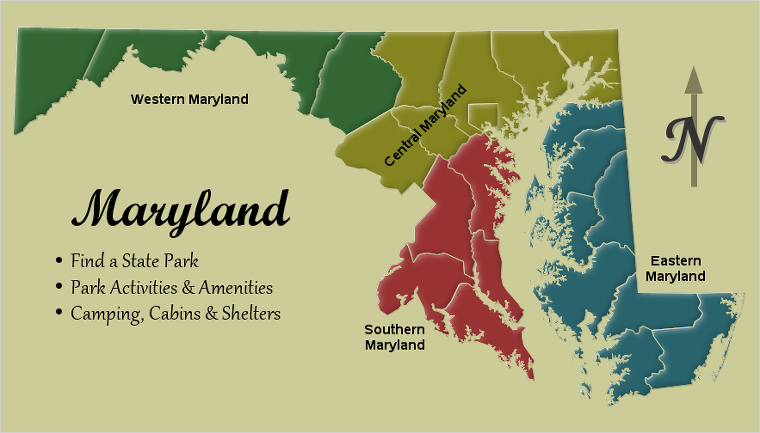

예술가들은 몇 가지 도구만으로도 멋진 그림을 그릴 수 있습니다. 물론, 물감, 색연필, 목탄 등 선호하는 도구는 저마다 다를 수 있겠지만 말이죠. SAS에서 멋진 그래프를 만드는 방법도 크게 다르지 않은데요, 오늘은 그 방법을 예를 들어 설명해보고자 합니다. SAS에서는 SAS/Graph Proc GMap을 사용하여 멋진 지도를 만들 수가 있습니다. GMap은 SAS가 지도 제작용으로 특별 개발한
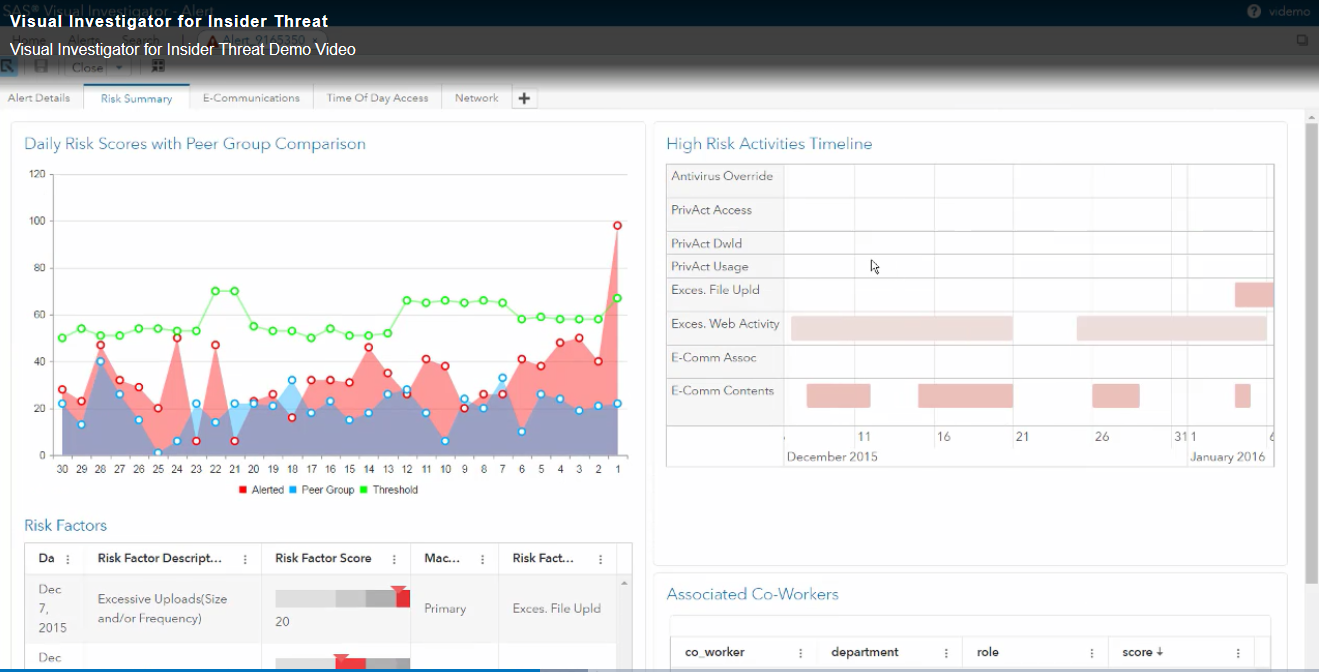

As Tax Week arrives, tax agencies may be overlooking fraud happening under their noses – fraud perpetrated by insider threats. While the agencies are focused on the hot fraud topics of the day – identity verification quizzing, protecting PIN files, and cybersecurity – insider threats pose a particularly insidious risk.
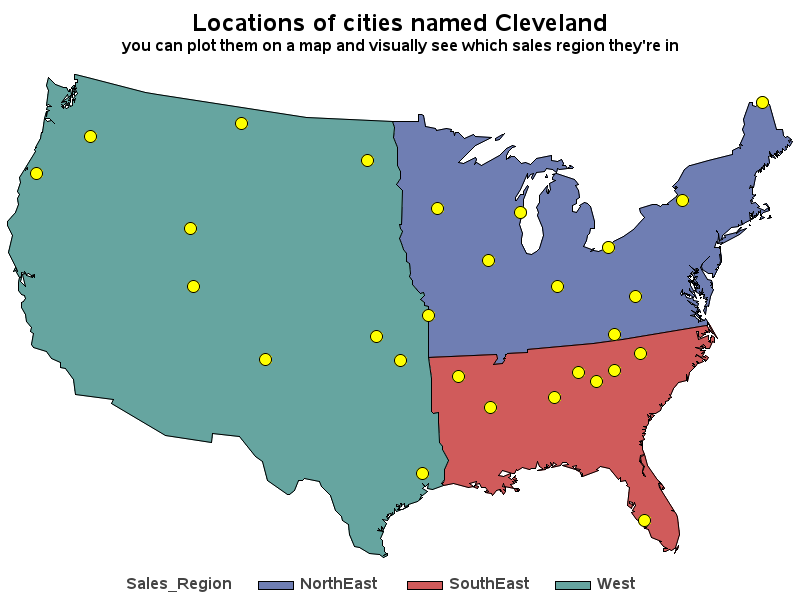

A new prospective customer enters their personal information on your web page, and they want to have a sales rep contact them ... but you need to know which sales region they're in, so you can assign them to a sales team. Now, multiply that by thousands of prospective customers!
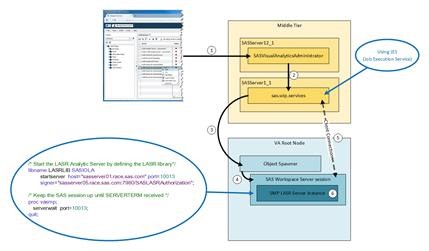

In this post, I will explain how LASR Servers (both Distributed and Non-distributed) are started from the SAS Visual Analytics Administrator application. We will also look at one particular issue and I will provide you with more details to understand the situation and two strategies to address this issue. When


Los datos no conocen fronteras. Este concepto enmarcó la edición número 42 del SAS Global Forum, el evento de analítica más grande del mundo que atrajo a más de 30.000 asistentes presenciales y virtuales. Durante cuatro días, profesionales de negocio y amantes de la tecnología, tuvimos la oportunidad de intercambiar


Dylan Jones says spend time setting a vision of how to transform your data landscape – not debating definitions.

유럽 연합(EU)의 자금세탁방지(AML; Anti-Money Laundering)와 고객 위험 평가에 대한 새로운 컴플라이언스 요구가 거세지고 있습니다. 이에 따라 앞으로 6개월 후 유럽 금융 업계는 큰 도전 과제에 부딪힐 것으로 보이는데요. 바로 유럽 연합의 ‘4차 자금세탁방지 지침(Fourth Anti-Money Laundering Directive)’ 때문입니다. 해당 지침과 관련된 모든 변경 사항들이 전면 시행되기까지 6개월도 채 남지 않았습니다.
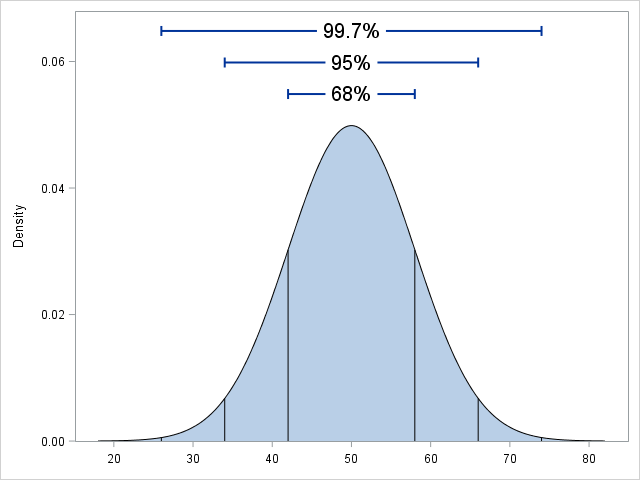

A reader commented on last week's article about constructing symmetric intervals. He wanted to know if I created it in SAS. Yes, the graph, which illustrates the so-called 68-95-99.7 rule for the normal distribution, was created by using several statements in the SGPLOT procedure in Base SAS The SERIES statement
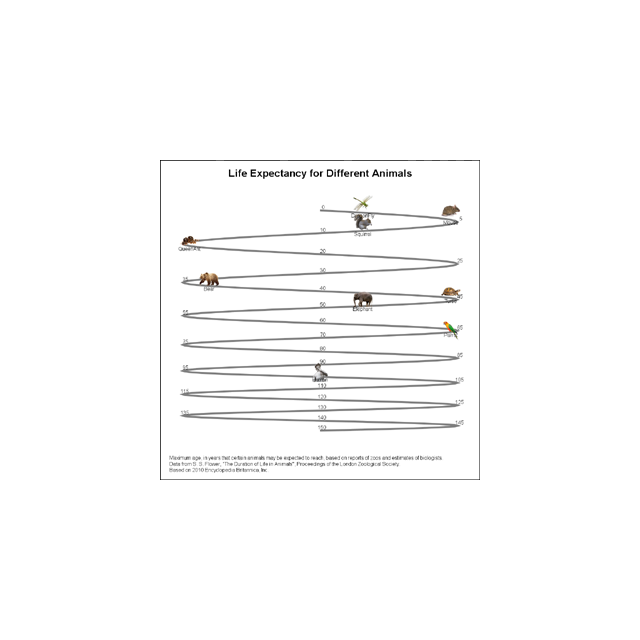

Last week I published an article on creating bar charts with visual category values. The idea was to use visual icons for the category values in a HBAR of age by animal. For the data, I referred to a visual from the 2010 Encyclopedia Britannica Inc. that I found on the
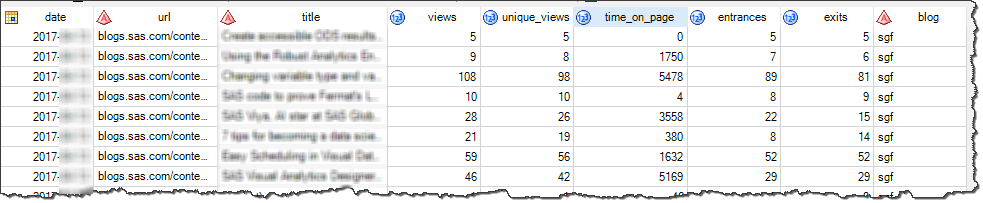

Every day before I even wake up, I have little "SAS robots" that do work for me. These are SAS batch jobs that gather data from external services and build data marts, generate reports, and send e-mail. One of those SAS jobs gathers Google Analytics data about our SAS blogs
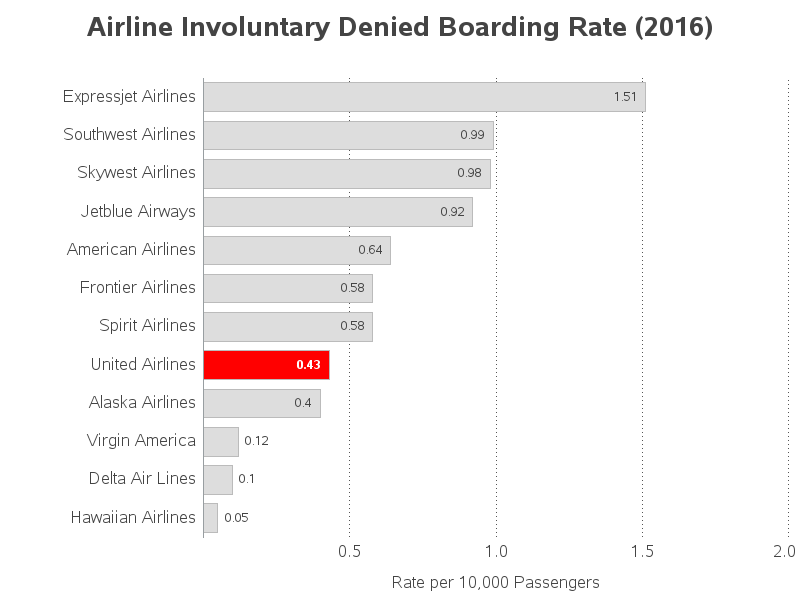
You've probably all seen the images of the passenger being forcibly removed from a United Airlines flight, to make room for airline staff flying on standby. The incident caused quite a bit of negative publicity, and quickly wiped out a quarter billion $ of the airline's market value. But did
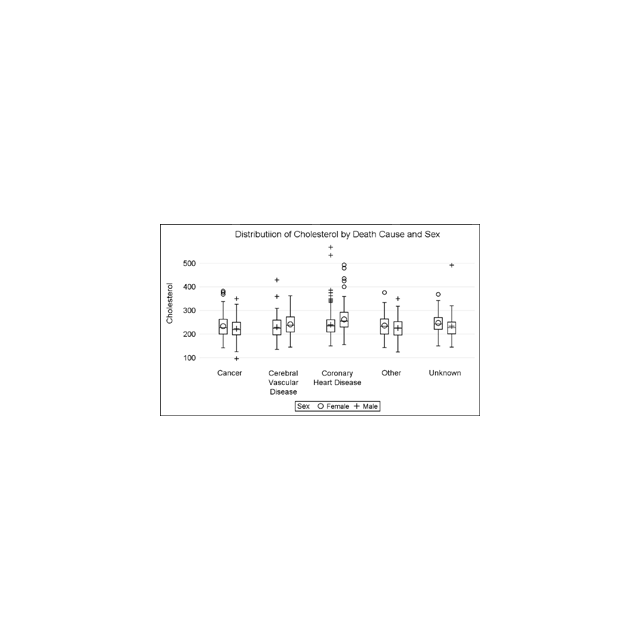
A grouped box plot created by SGPLOT VBOX / HBOX statement or GTL BOXPLOT statement will display groups within categories using group colors and puts the color swatches representing the group values in the legend. This works well for a color graph created as shown below. title 'Distribution of Cholesterol