All Posts

When I teach my Data Cleaning course, the last topic I cover in the two-day course is SAS Integrity Constraints. I find that most of the students, who are usually quite advanced programmers, have never heard of Integrity Constraints (abbreviated ICs). I decided a short discussion on this topic would
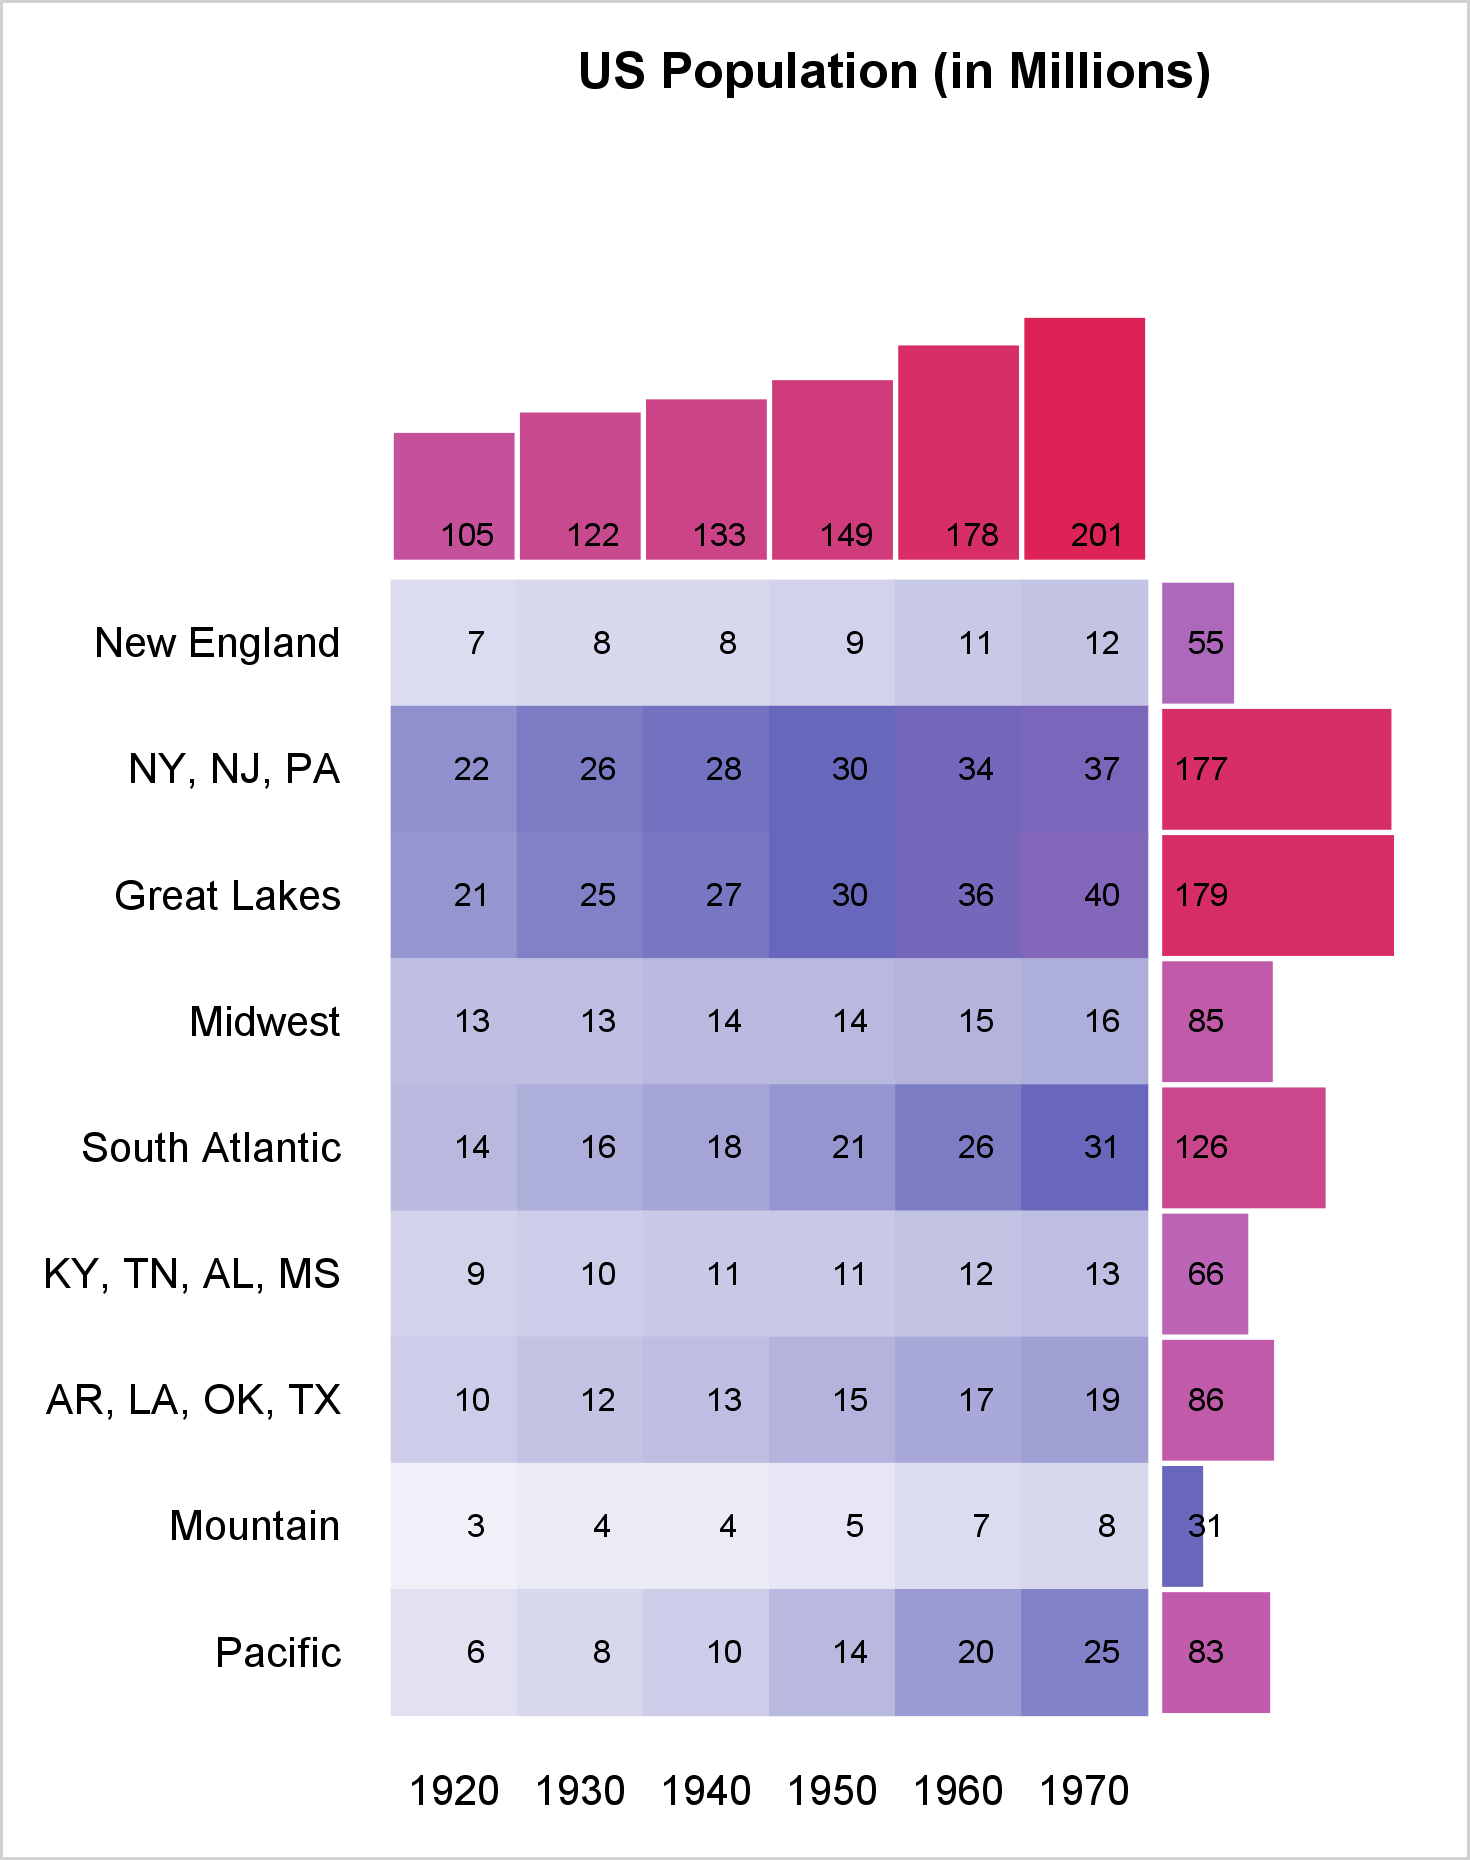

You can use a range attribute map to control the mapping of values in a continuous variable to colors. This post shows you how to use PROC SGPLOT to display multiple plots in the same graph and use range attribute maps.


The role of analytics in combating terrorism Earlier this spring, I found myself walking through a quiet and peaceful grove of spruce trees south of the small hamlet of Foy outside of Bastogne, Belgium. On travel in Europe, I happened to have some extra time before heading to London. I


The new government’s vision of Brexit is to make the UK a more international, more outward looking nation. One whose future success and status in on the world stage will be dictated by the ability to attract investment and finance, and to drive trade with existing and new partners. Yet

My presentation at SAS Global Forum 2017 was "More Than Matrices: SAS/IML Software Supports New Data Structures." The paper was published in the conference proceedings several months ago, but I recently recorded a short video that gives an overview of using the new data structures in SAS/IML 14.2: If your
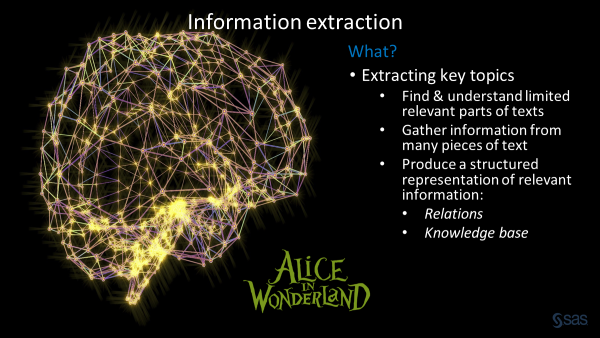

To demonstrate the power of text mining and the insights it can uncover, I used SAS Text Mining technologies to extract the underlying key topics of the children's classic Alice in Wonderland. I want to show you what Alice in Wonderland can tell us about both human intelligence and artificial


A new book from SAS guides public sector leaders in the use of data to address a wide range of state and local government challenges. Each chapter deals with critical issues facing our country, including the opioid epidemic, child abuse, spiraling health care costs, prison overcrowding, education reform, rampant fraud and the

La primera vez que alguien se refirió al Internet de las Cosas fue en 1999 y se trató del emprendedor Kevin Ashton, uno de los fundadores del centro Auto-ID en el MIT, quien lo acotó durante una presentación sobre la posibilidad de vincular objetos a través de la identificación por


Dictionary tables are one of the things I love most about SQL! What a useful thing it is to be able to programmatically determine what your data looks like so you can write self-modifying and data-driven programs. While PROC SQL has a great set of dictionary tables, they all rely


La vida de un infante es frágil y cuelga de un delgado hilo. Desde los recién nacidos prematuros hasta los bebés con meses de edad que luchan con problemas médicos, las unidades de cuidados intensivos neonatales (UCIN) tienen que estar preparadas para todo. Es por eso que los médicos, las


여러분은 ‘프로파일링(profiling)’하면 뭐가 제일 먼저 생각나나요? 아마 많은 분들이 범인을 추적하는 범죄 프로파일러(profiler)를 떠올릴 것 같은데요. 맞습니다. 프로파일링은 범죄 현장과 증거를 분석해 용의자의 범행 수법은 물론 성별, 나이, 습관, 성격, 직업 등을 추론하고 범인을 찾아내는 범죄 수사 기법 중 하나인데요. 최근 범죄 심리학을 다룬 드라마와 영화가 큰 인기를 끌며 대중에


La industria financiera, ha desarrollado una alta dependencia en la analítica predictiva para alcanzar los objetivos de negocio y cumplir con temas regulatorios y de mejores prácticas. Este modelado toca virtualmente a cada área que tiene poder de decisión y monitoreo en la Entidad, desde el perfil de cliente objetivo,
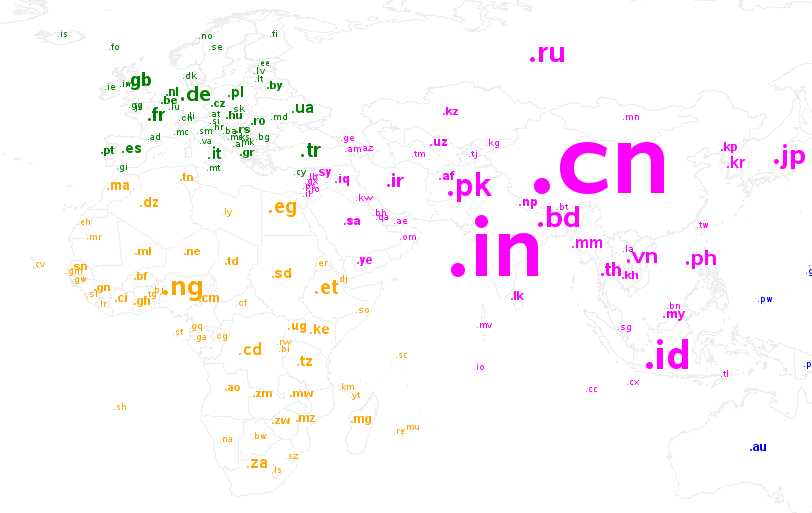

Here in the US, we typically use top level domains such as .com, .gov, and .org. I guess we were one of the first countries to start using web domains in a big way, and therefore we kind of got squatter's rights. As other countries started using the web, they
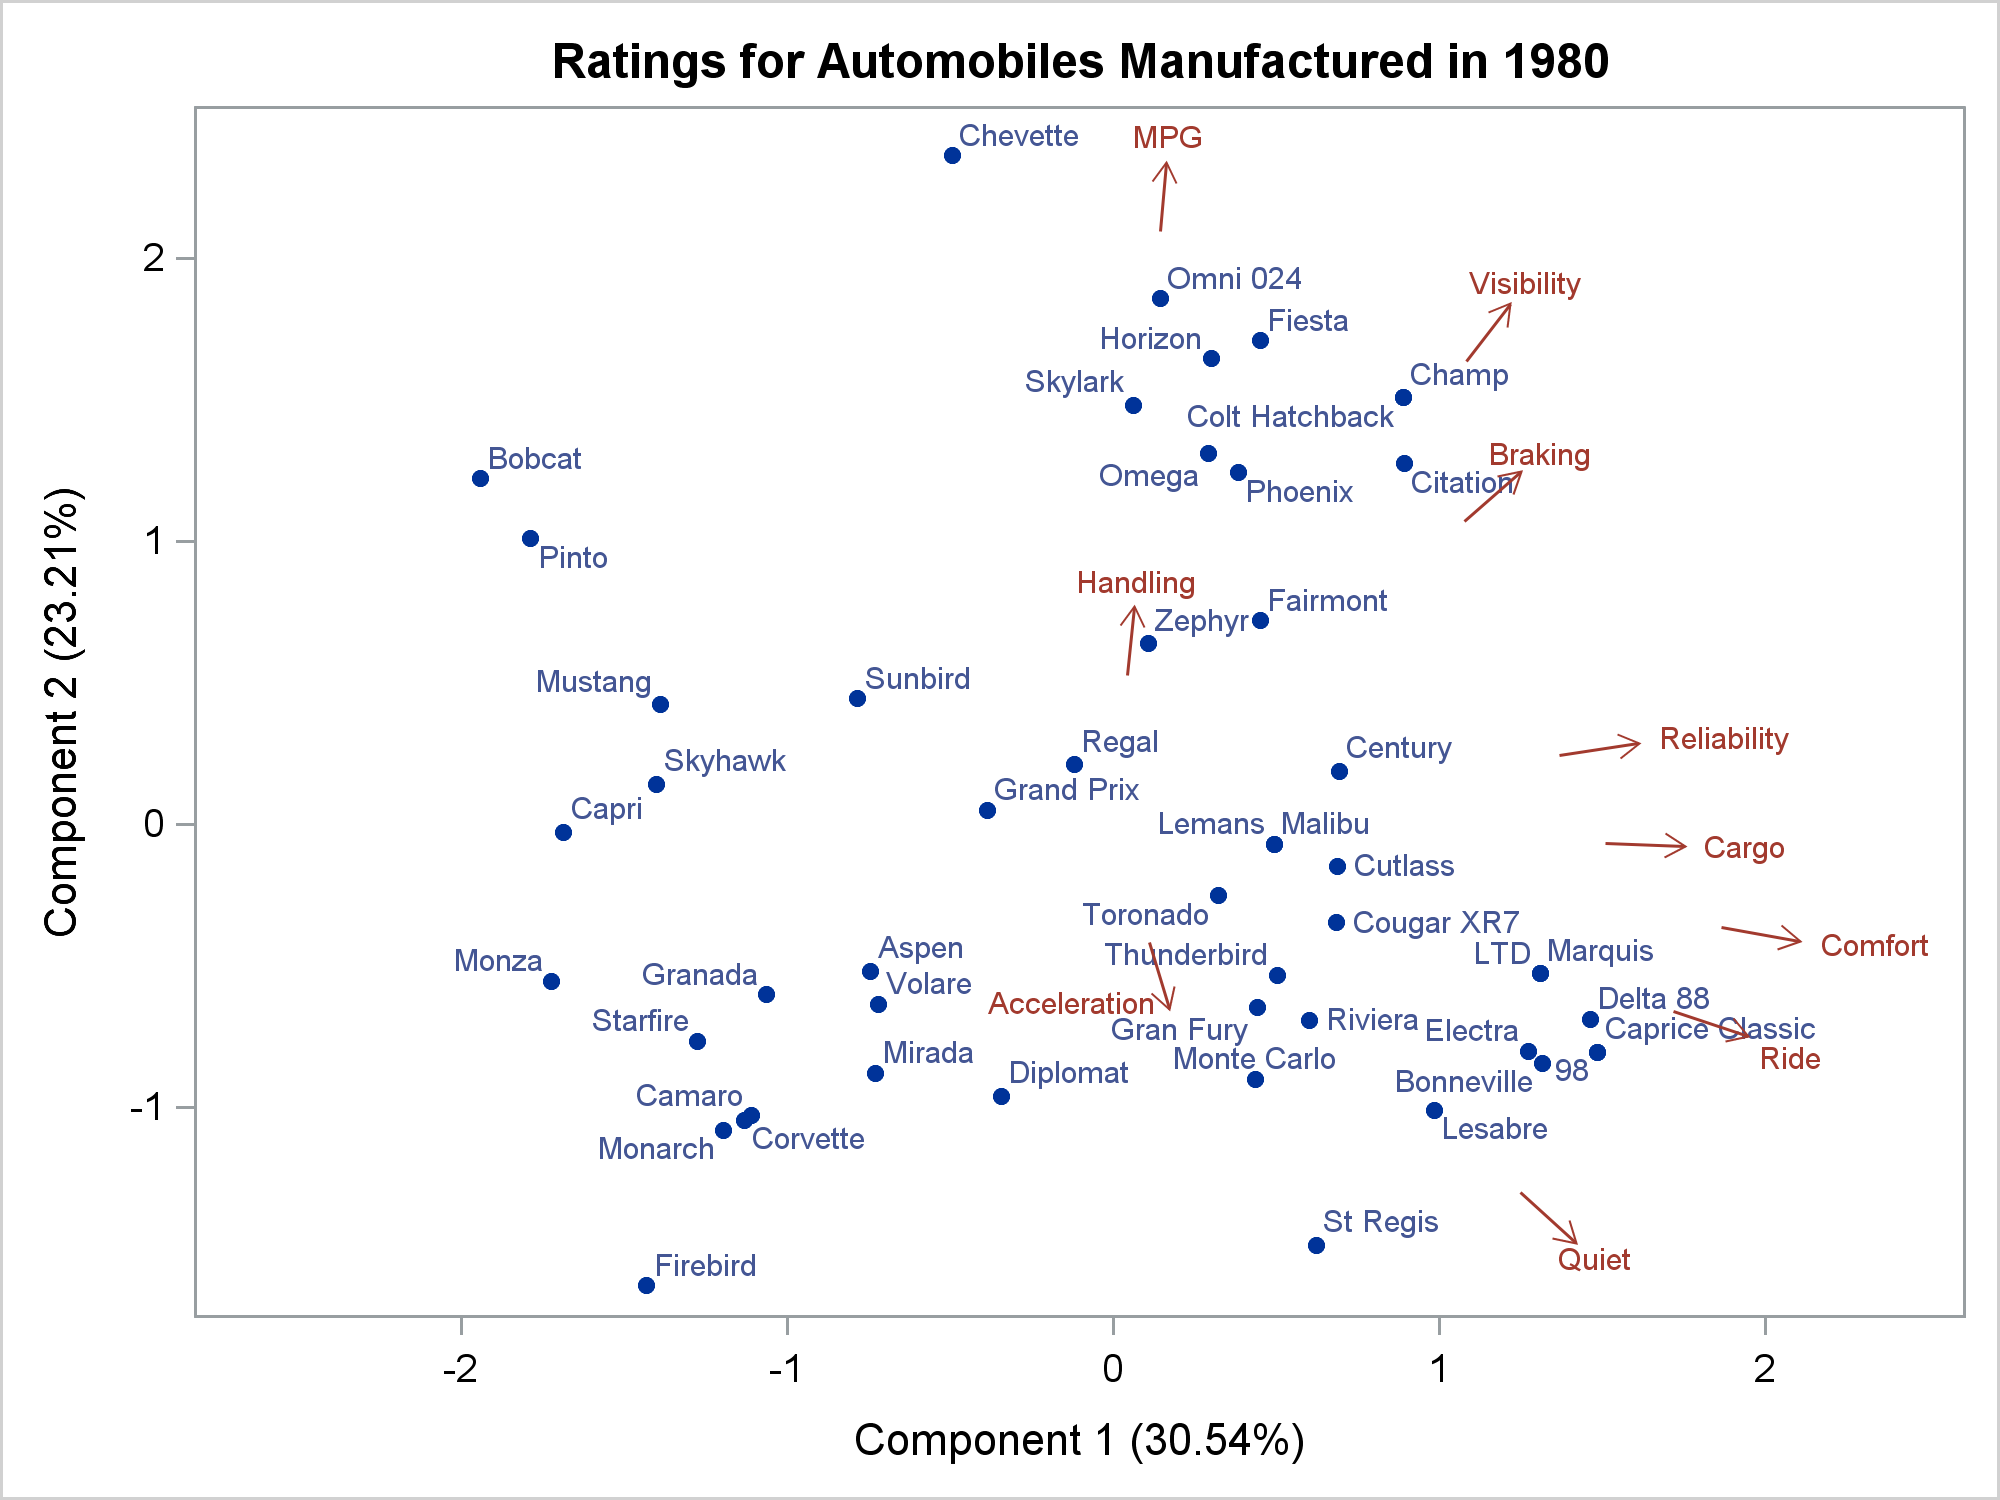
A vector plot draws a line from one point in a graph to another point. In this post, I will show you how to create short vectors instead of vectors that emanate from the origin. I also show how to modify the positions of the vector labels.

Time is marching on, despite my best efforts to slow it down. Larkin graduated from Enloe High School last week, and leaves for Virginia Tech in August. I am filled with joy and despair, often simultaneously, laughing through my tears, trying desperately to enjoy every minute with him and yet