All Posts
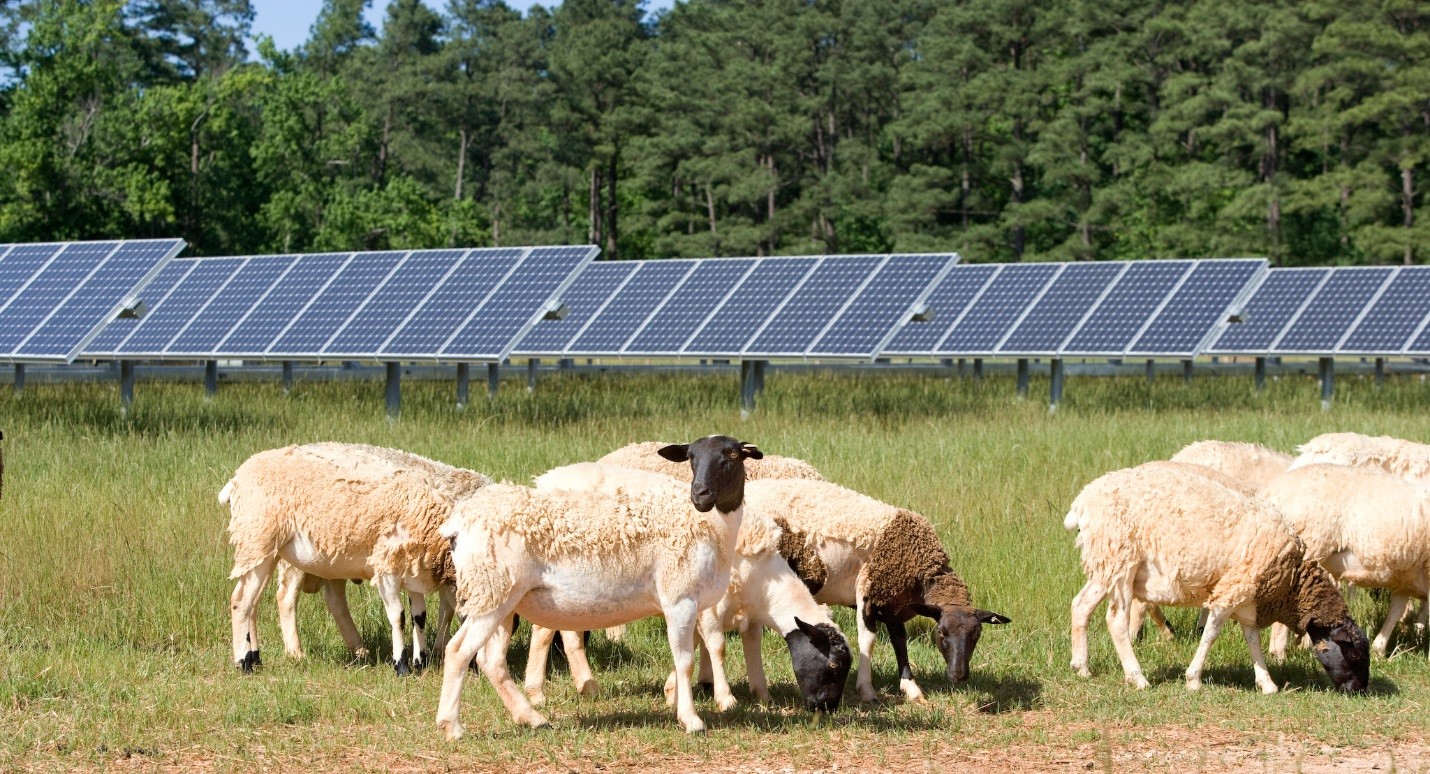

Did you know that SAS has two on-site solar farms? At a combined 2.3 MW in capacity, SAS’ solar farms are located on 12 acres at world headquarters in Cary, NC. The photovoltaic (PV) solar arrays generate 3.8 million kilowatt-hours of clean, renewable energy each year, reducing carbon dioxide emissions
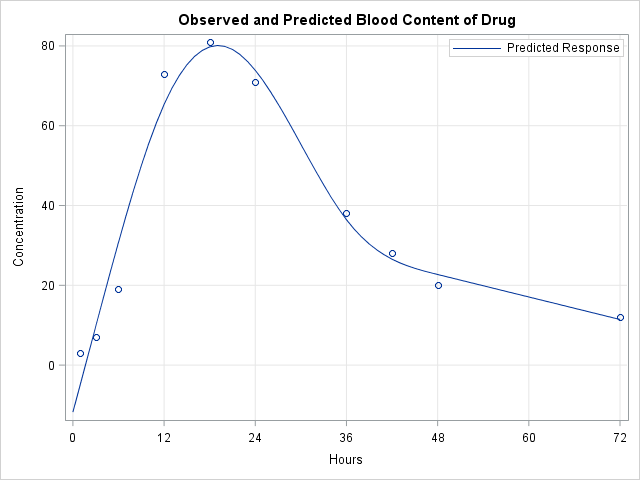

SAS enables you to evaluate a regression model at any location within the range of the data. However, sometimes you might be interested in how the predicted response is increasing or decreasing at specified locations. You can use finite differences to compute the slope (first derivative) of a regression model.


Atualmente, os dados são um dos ativos mais importantes das organizações. As organizações reúnem diferentes tipos de dados que são posteriormente processados e analisados para uma melhor compreensão da evolução das necessidades dos seus clientes. Os termos Business Analytics e Business Intelligence fazem parte da solução que ajuda as organizações a tomarem decisões baseadas
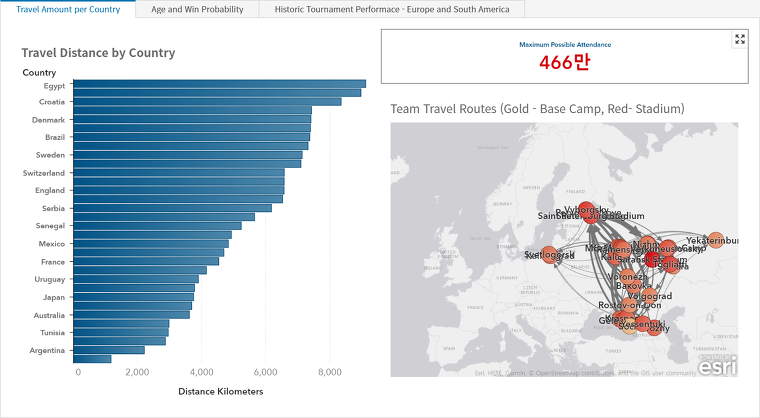

전 세계의 이목이 러시아에 향해 있습니다. 바로 2018년 국제 축구 대회 때문인데요. 오늘은 바로 이 국제 축구 대회에 대한 다양한 데이터를 시각화하고, 지난 대회 결과로부터 어떤 인사이트를 얻을 수 있는지 살펴보고자 합니다! 전 세계 축구팀들은 대회를 위해 얼마나 멀리 이동할까요? 데이터 시각화 리포트가 보이지 않으시면 클릭하세요. 위 보고서는 참가국들이 조별 리그 동안 얼마나 멀리


前回は、SASの「Pipefitter」の基本的な使用方法を紹介しました。続く今回は、基本内容を踏まえ、ひとつの応用例を紹介します。 SAS Viyaのディープラーニング手法の一つであるCNNを「特徴抽出器」として、決定木、勾配ブースティングなどを「分類器」として使用することで、データ数が多くないと精度が出ないCNNの欠点を、データ数が少なくても精度が出る「従来の機械学習手法」で補強するという方法が、画像解析の分野でも応用されています。 以下は、SAS Viyaに搭載のディープラーニング(CNN)で、ImageNetのデータを学習させ、そのモデルに以下の複数のイルカとキリンの画像をテストデータとして当てはめたモデルのpooling層で出力した特徴空間に決定木をかけている例です。 In [17]: te_img.show(8,4) 以下はCNNの構造の定義です。 Build a simple CNN model In [18]: from dlpy import Model, Sequential from dlpy.layers import * from dlpy.applications import * In [19]: model1 = Sequential(sess, model_table='Simple_CNN') Input Layer In [20]: model1.add(InputLayer(3, 224, 224, offsets=tr_img.channel_means)) NOTE: Input

O mundo interconectado. Um mundo inteligente. Onde as empresas/marcas têm acesso a dados que permitem oferecer, aos clientes, soluções/produtos personalizados. Bem-vindos ao mundo (utópico?) da Internet das Coisas. Mas será que esta visão é viável? Como é que as empresas conseguirão atingir este cenário? Falámos com um dos especialistas na
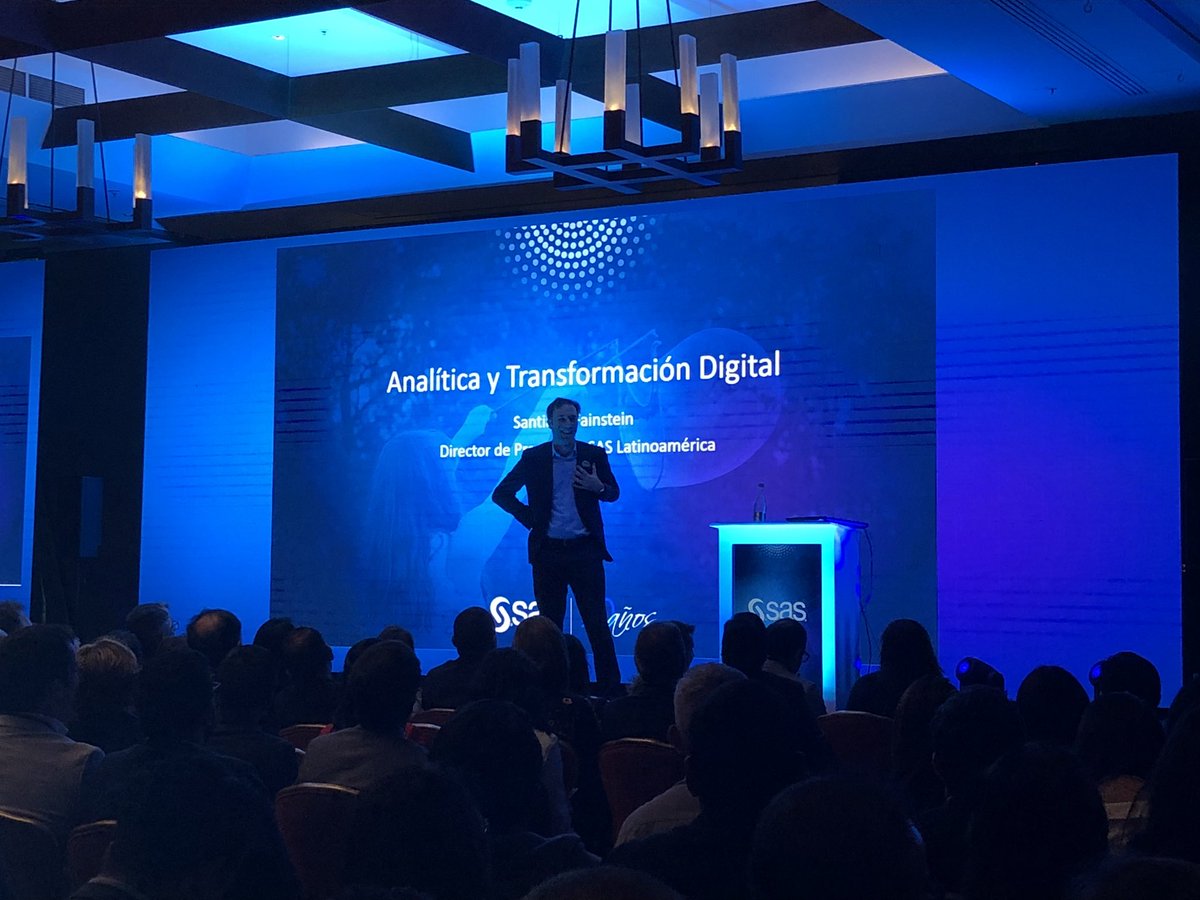

En el marco de la 4ª Convención Latinoamericana de Analítica, uno de los temas centrales fue la importancia de que las empresas saquen todo el potencial de sus datos para que la tecnología que implementan pueda mostrar su máximo valor en el marco de la Transformación Digital de sus negocios.


Cae una lluvia torrencial en un área densamente poblada. Los niveles se elevan rápidamente. Al llegar a un punto determinado, un sensor envía una señal a un centro de control desde el cual se abren unas compuertas que aceleran el desahogo de las aguas pluviales para evitar inundaciones. En otro
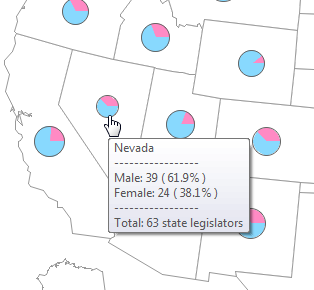

In FiveThirtyEight's Significant Digits section, they recently mentioned that nine states could potentially have 50% or more females in their legislature after the upcoming election. My first thought - I need to see some graphs! They linked to a New York Times article that had some interesting graphs. There was
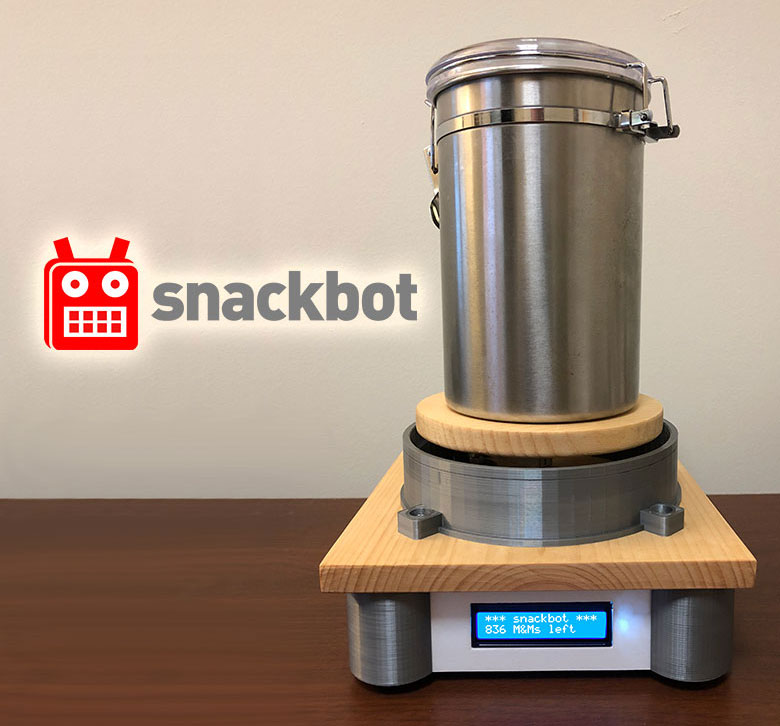

At SAS, we love data. Data is central to our corporate vision: to transform a world of data into a world of intelligence. We're also famous for enjoying M&Ms, but to us they are more than a sweet snack. They're also another source of data. My colleague Pete Privitera, with


In the second part of this series, Phil Simon argues that organizations can immediately take steps to handle likely legislation.


Looking to connect and engage with other like-minded people in a meaningful way? A #SASchat might just what you’re looking for! #SASChat is SAS’ version of a Twitter chat: a live, online event that works like any get-together. Participating in a #SASchat is a great way to: Engage with an
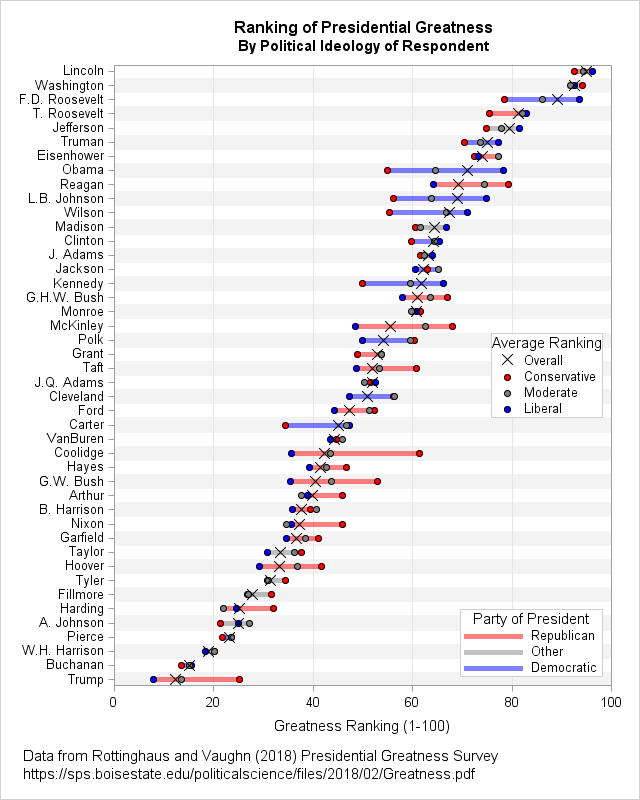
Which president of the United States is ranked the greatest by presidential historians? This article visualizes the results of the 2018 Presidential Greatness Survey, which was created and administered by B. Rottinghaus and J. Vaughn. They analyzed 166 responses from experts in political science who ranked the 44 US presidents
SASでは、Python向けパッケージ/ライブラリとして、機械学習のパイプラインの実装を簡素化する「Pipefitter」を提供しています。 SASの「Pipefitter」パッケージは、SAS Viyaまたは、SAS v9の反復可能なワークフローの一つの段階として、データ変換とモデルフィッティング向けパイプラインを開発するためのPython APIを提供します。 このパッケージを使用すると、SASでデータを操作して、次のような処理を実装できます: ・欠損値補完 ・デシジョンツリー、ニューラルネットワーク、およびその他の機械学習テクニックを使用したパラメータ推定値の適合 ・ハイパーパラメータチューニングを使用したモデル選択の高速化 ・スコアリングとモデル評価 「Pipefitter」のもう一つの重要な特徴は、SASが提供する他の2つのPythonパッケージの能力に基づいていることです。 SWAT: SAS Viyaプラットフォームのインメモリー分析エンジンであるSAS Cloud Analytic Services(CAS)を活用し様々なデータ操作や分析を可能にするPython向けパッケージ SASPy: SAS9.4の機能を活用し、分析、データ操作、および視覚化を行うためのPython向けパッケージ ロジスティック回帰でのパラメータ推定などのパイプライン処理は、SASPyを介してSAS 9で、SWATを介してCASで同じように実行されるように設計されています。 以下は、タイタニック号の乗船者データに基づくパイプラインの例です。 まず、KaggleのサイトからPandas DataFrameにデータをダウンロードします。 In [1]: import pandas as pd In [2]: train = pd.read_csv('http://s3.amazonaws.com/assets.datacamp.com/course/Kaggle/train.csv') In [3]: train.head() Out[3]: PassengerId Survived Pclass 0 1 0 3 1 2 1
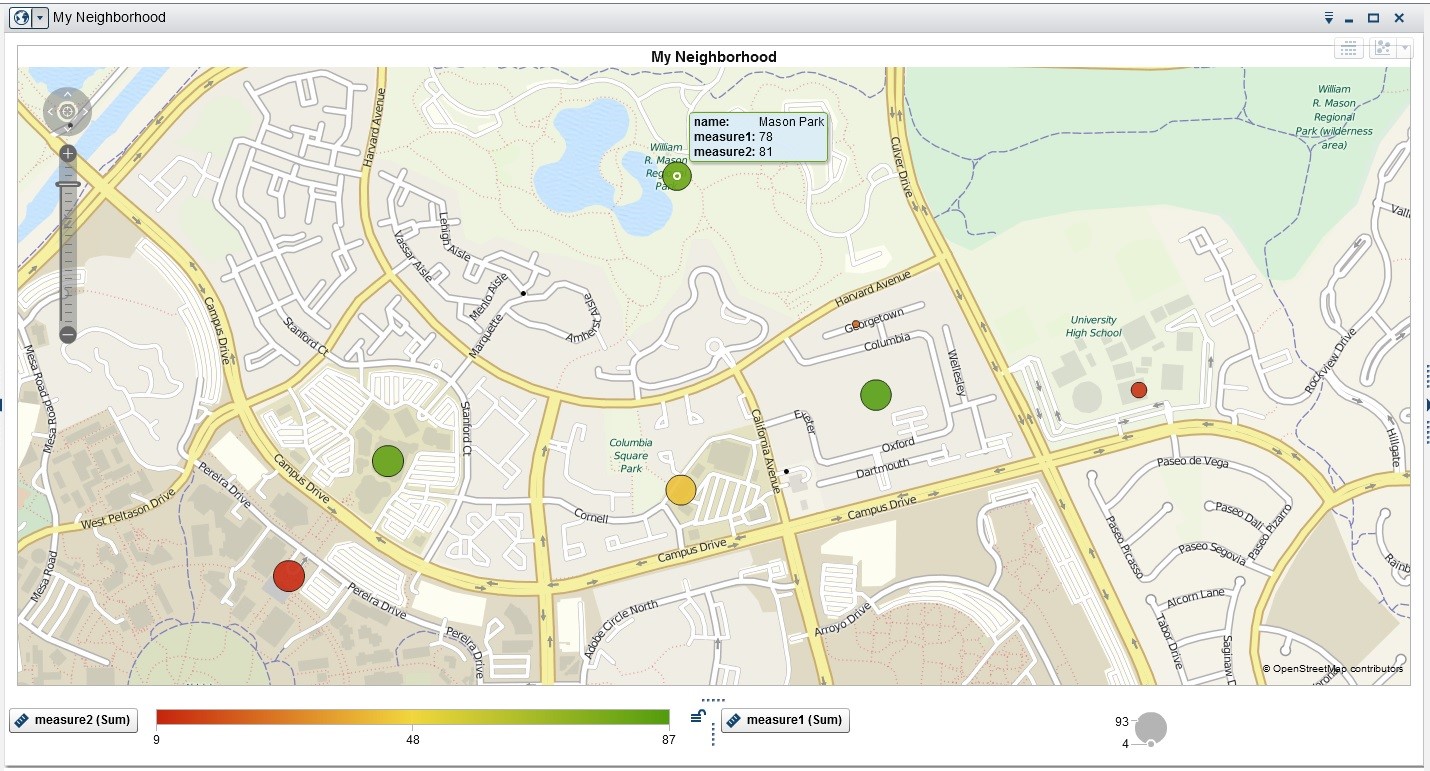

The Geo Map Visualization has several built-in geographical units, including country and region names and codes, US state names and codes, and US zip codes. You can also define your own geographic units. This paper describes how to identify any geographic point of interest, or collection of points, on a map to create custom maps in SAS.