Which president of the United States is ranked the greatest by presidential historians? This article visualizes the results of the 2018 Presidential Greatness Survey, which was created and administered by B. Rottinghaus and J. Vaughn. They analyzed 166 responses from experts in political science who ranked the 44 US presidents on a 0–100 "greatness scale" where 0 represents abject failure, 50 is average, and 100 is great. The survey results are presented in their 2018 report.
Table 1 of the report (p. 2-3) provides the average greatness scores of the presidents among all respondents. Just as "beauty is in the eye of the beholder," so too "greatness" is a subjective notion that depends on the values and beliefs of the assessor. Table 2A (p. 6-7) provides the average greatness scores for respondents by the political party and political ideology of the respondents. Of the respondents, 57.2% were Democrats, 30.1% were Independent or Other, and 12.7% were Republicans. Similarly, 58.4% self-identified as liberal or somewhat liberal, 24.1% self-identified as moderate, and 17.5% reported being conservative or somewhat conservative. The relatively large proportion of liberals should be considered when interpreting the survey results.
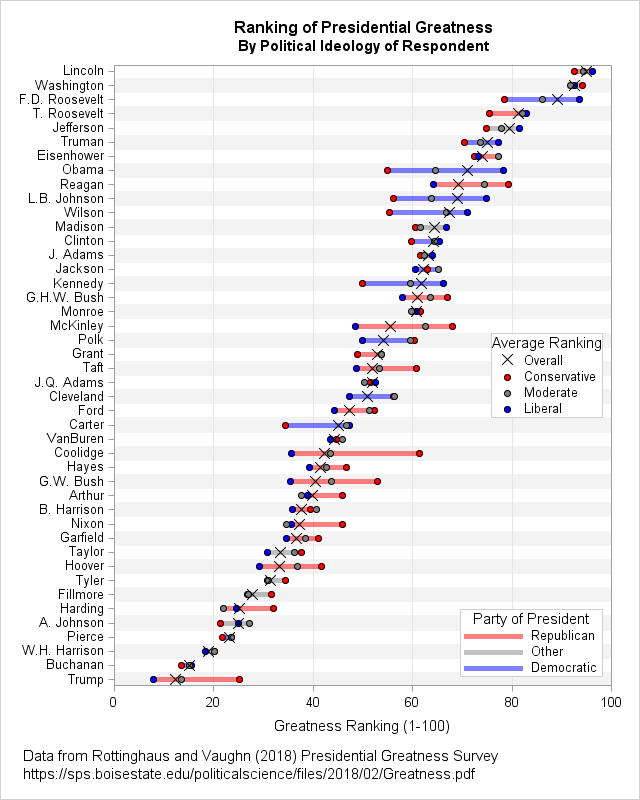
I imported the survey results into SAS and combined them to produce a visualization of the data. The graph at the right (click to enlarge) shows the presidents ranked by their overall mean greatness score, which is shown by an X. The mean scores for the conservative, moderate, and liberal respondents are shown as filled circles. The party of the president is indicated by a colored bar that shows the range of scores.
A few results are apparent from the graph:
- Lincoln, Washington, FDR, Teddy Roosevelt, and Jefferson are the five greatest presidents according to these experts.
- Obama and Reagan are two recent presidents who are ranked highly.
- Statistically speaking, there are large groups of presidents for which the relative ranking is uncertain. For example, the presidents ranked 12–20 (Madison through Monroe) have mean scores that are similar.
- The current president, Donald Trump, is ranked last. In fairness, Trump had not yet completed his first year in office at the time of the survey (December 2017). The authors of the report dedicate several pages (p. 10–13) analyzing a survey question about who was the Most Polarizing president, a category that Trump won handily.
- Other presidents who scored low include James Buchanan (the "Do-Nothing President"), William Henry Harrison (who died 31 days into his term), and Franklin Pierce (a weak leader in a contentious pre-Civil War era).
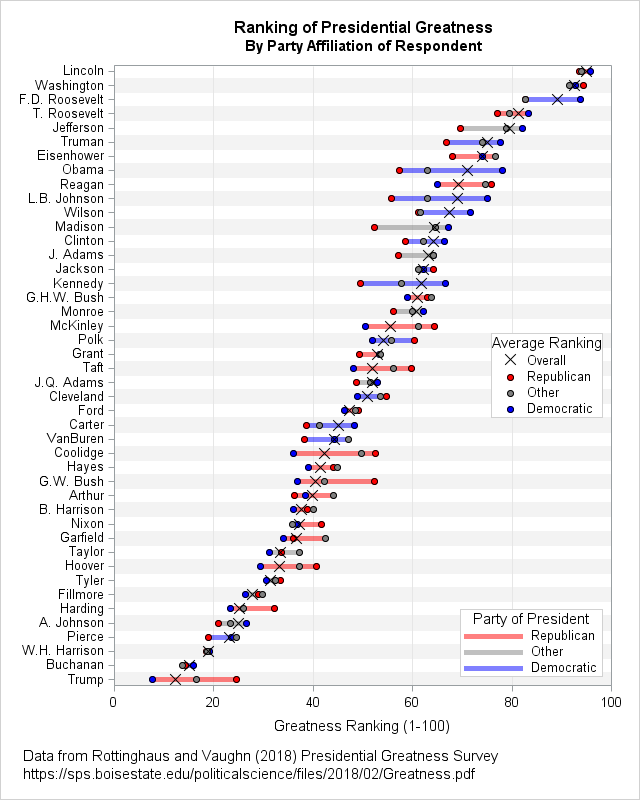
You can also graph the data by using the political parties of the experts rather than their ideologies. The graph is very similar.
Bias and disagreement in ranking presidents
One of the most interesting aspects of these data is the relative widths of the ranges of most 20th and 21st century presidents. These wide intervals are caused when experts of one political ideology judge a president much differently than experts from another ideology. Typically, the conservative-liberal disparity amounts to 10–15 points on the "greatness" scale, but for several presidents (Coolidge and Obama) the average conservative score is more than 20 points different from the average liberal score.
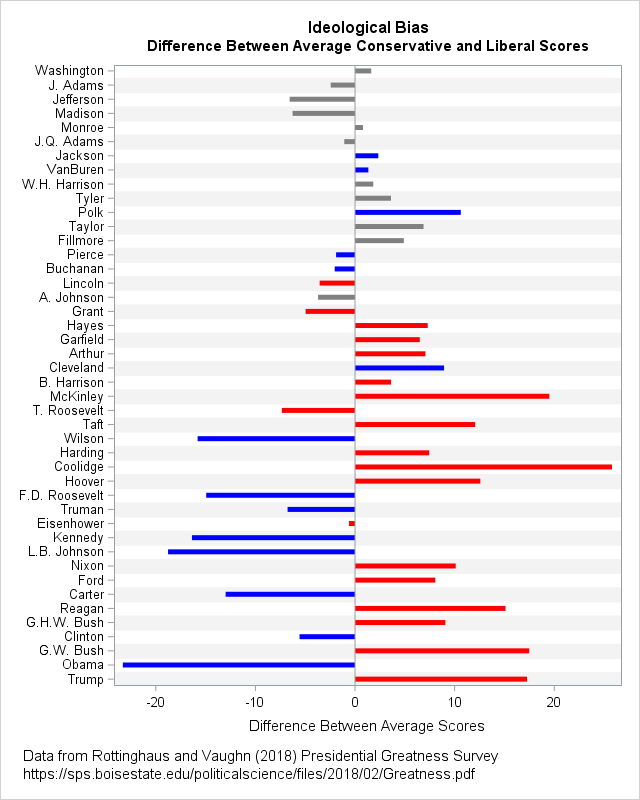
This disparity is evidence of the partisan state of politics in the US. Even these experts, who presumably use historical facts rather than opinions to guide their ranking, are not immune from seeing current events through the lens of their own personal values and biases.
To better visualize the range of disagreement among the experts, I graphed the difference between the conservative and liberal scores for each president. Again, the color of the line indicates the political party of the president. The 20th century began with McKinley's presidency. For almost every president since McKinley, the gap for Democratic presidents is negative, indicating that the conservative experts judged the presidency less favorably than the liberal experts. For Republican presidents, the direction of the gap is reversed: the conservative experts ranked the presidency more favorably than their liberal counterparts. The exception is Teddy Roosevelt, whose progressive agenda (the "Square Deal" and conservation measures such as national parks and forests) appeals to liberal experts.
Summary
Rottinghaus and Vaughn's 2018 Presidential Greatness Survey analyzes the opinions of 166 experts as to which US presidents are considered great, average, or a failure. The first graph in this blog post shows that although there is general agreement among experts for many 18th and 19th century presidents (Lincoln and Washington were great; Pierce, W. H. Harrison, and Buchanan were not.), there is less agreement for modern presidents. As seen in the second graph, the variation tends to correlate along ideological grounds, with conservatives and liberals having very different views about which presidents were great.
You can download the SAS program that creates the graphs in this article. For a different visualization of these data, see Robert Lawrence's article "All the U.S. Presidents, Ranked by 'Greatness'."

1 Comment
Thanks for the shout out!