All Posts


I attended the Scottish Highland Games this past weekend ... nearby in Scotland County, North Carolina! They put on a great event, with kilt-wearing Scotsmen throwing things, bands playing bagpipes, kids dancing, and clans sharing their family history. And to get into the mood for this event, I decided to

Self-service BI applications make gaining insights and decision making faster. But they've also generated a greater need for governance, including understanding the data lifecycle. You can find out where your data comes from with SAS Lineage Viewer. The post tells you how.


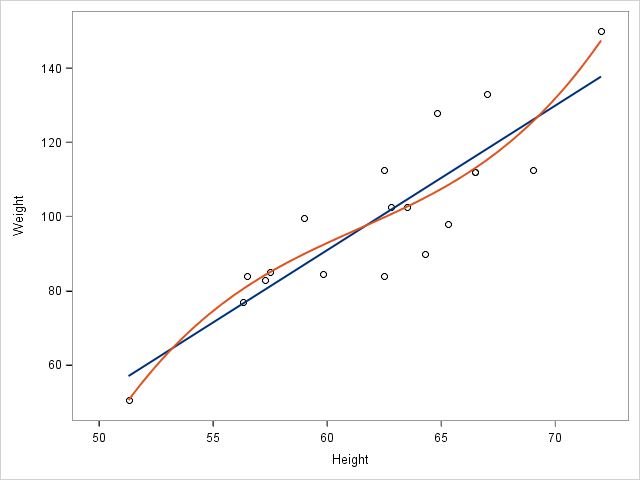
The STYLEATTRS statement in PROC SGPLOT enables you to override colors, markers, line patterns, fill patterns, and axis break patterns in ODS styles, without requiring you to change the ODS style template.


Reading has been a part of who I am as far as I can remember. I loved listening to books as a curious child and enjoyed an audience when learning to read on my own. During grad school research, I often found myself curiously digging into one topic that led


This article compares several ways to find the elements that are common to multiple sets. I test which method is the fastest in the SAS/IML language. However, all algorithms are intrinsically fast, which raises an important question: when is it worth the time and effort to optimize an algorithm? The


Las empresas están expresando una creciente necesidad por integrar toda su data y obtener conocimiento de manera inmediata, y así poder llegar a una toma de decisiones rápida e inteligente. Para que este proceso sea efectivo, muchas organizaciones están haciendo uso de los análisis de datos en tiempo real, un

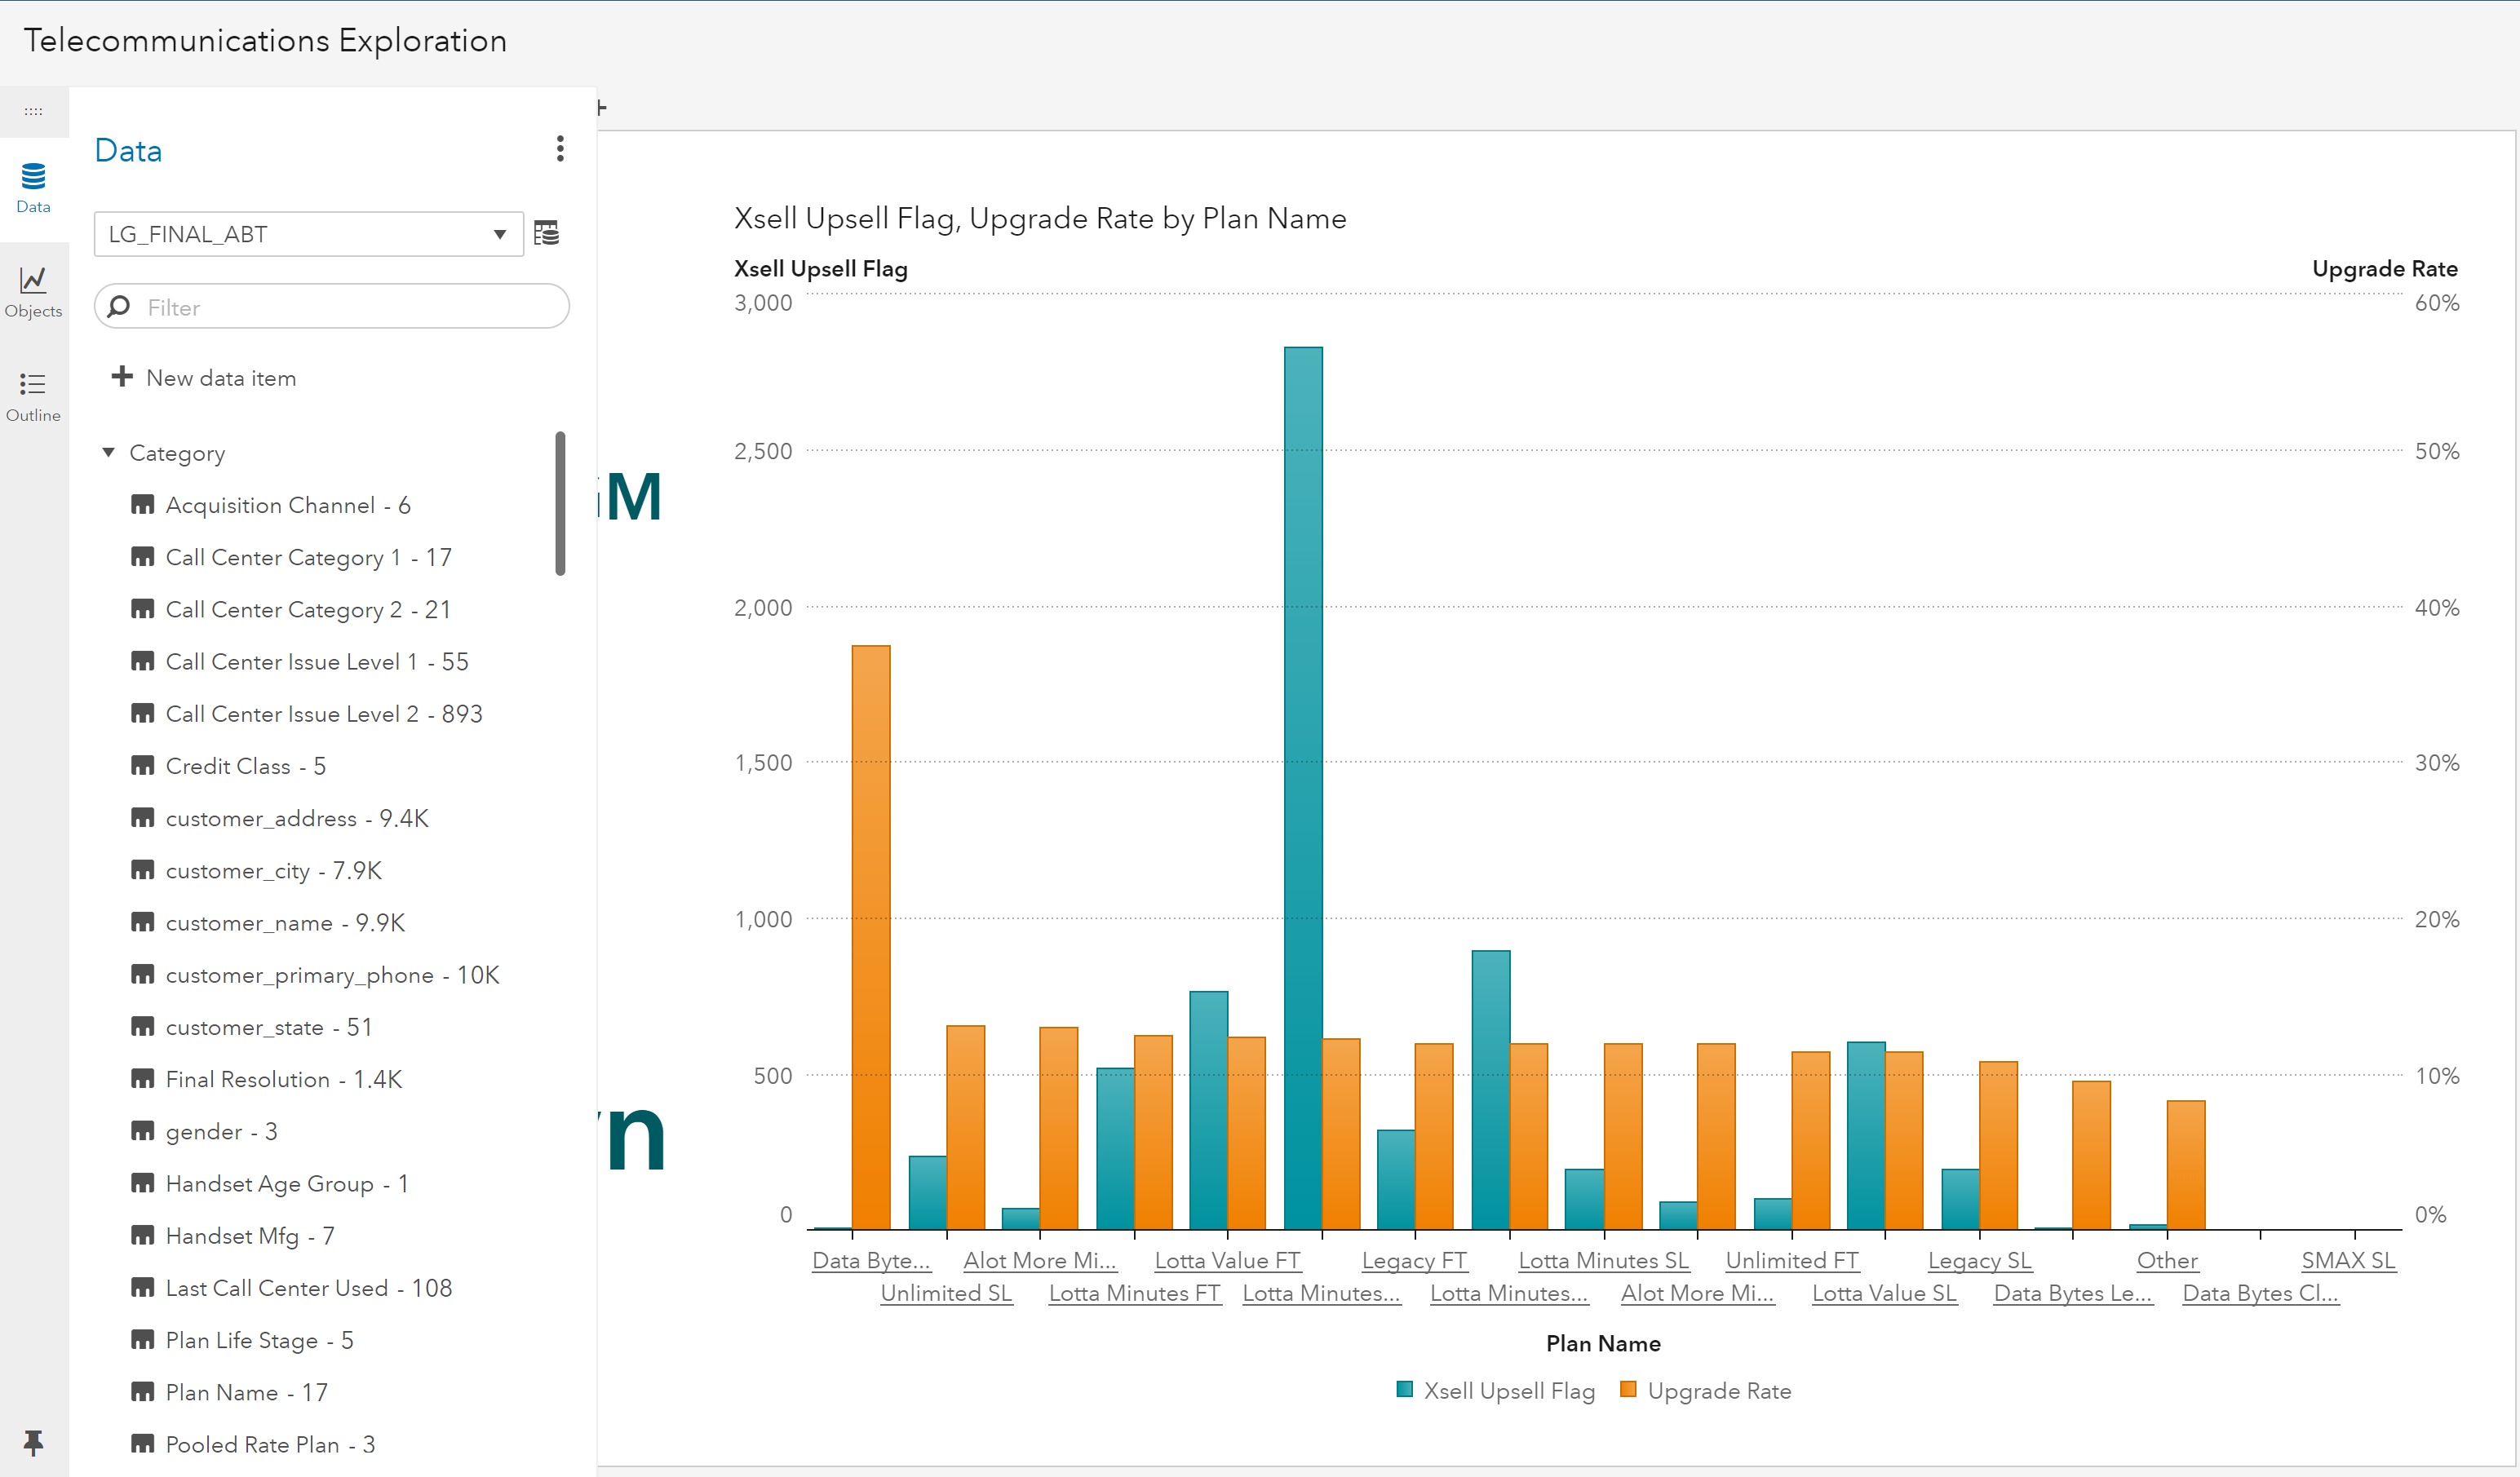
Do you work with custom polygon maps in SAS Visual Analytics? Read about a few "gotchas" to help you troubleshoot some common issues you may encounter.
You can use SG annotation to display graphs inside of other graphs.


"An interview is a two-way street. The interviewers are there to learn more about you, but you, too, should see this as a chance to learn more about the school or program for which you are interviewing." Most high schoolers have never been interviewed for a job. So when it
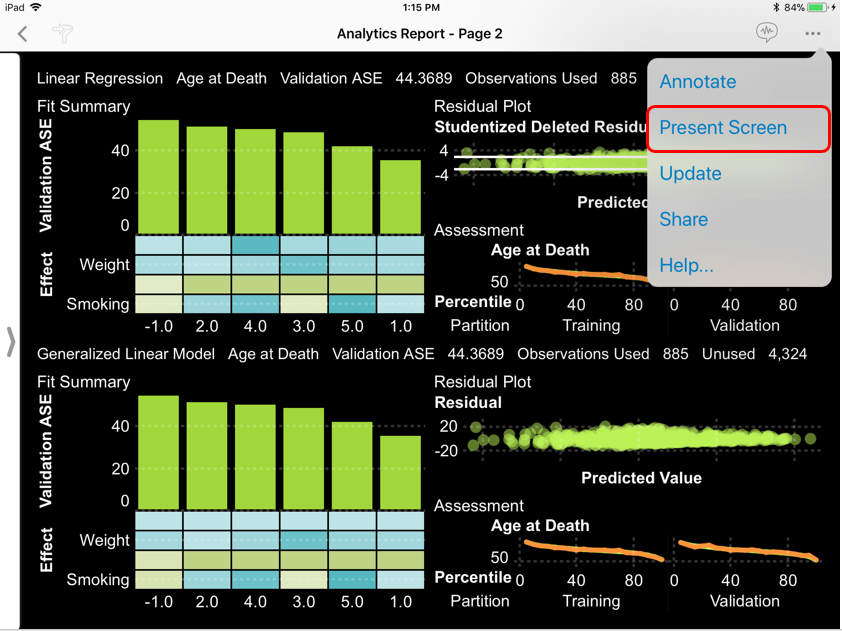

Demo SAS Visual Analytics live on your mobile device to your team across the world. Read this post for the details.
It is sometimes necessary for researchers to simulate data with thousands of variables. It is easy to simulate thousands of uncorrelated variables, but more difficult to simulate thousands of correlated variables. For that, you can generate a correlation matrix that has special properties, such as a Toeplitz matrix or a
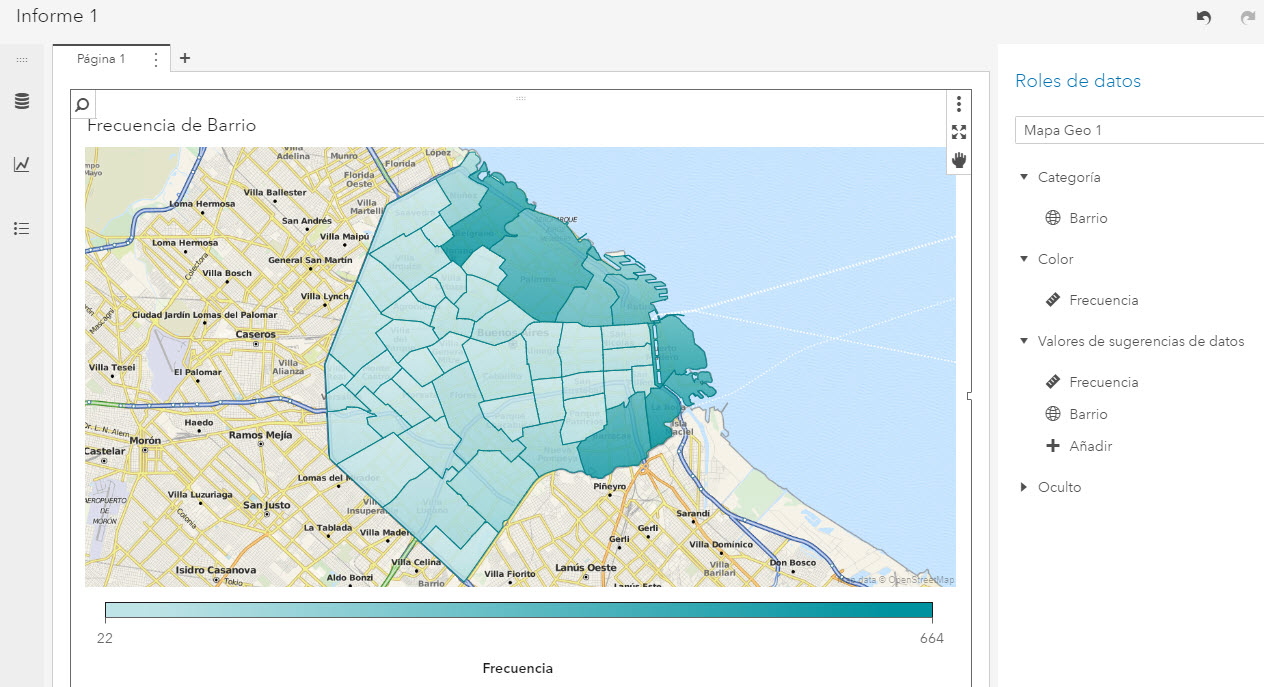

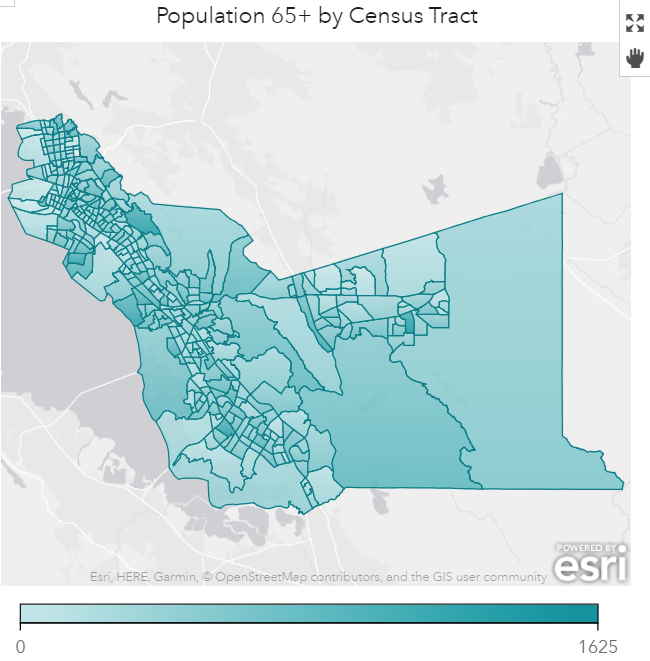
En los últimos años, con el creciente volumen de datos sobre localización provenientes de smartphones, Smart Watches y sensores, el interés por el análisis basado en la ubicación se ha expandido a todas las industrias. Como resultado, muchos de nuestros clientes nos preguntan cómo crear mapas regionales o polígonos personalizados


“Antes de correr, hay que aprender a caminar” es una consigna que hemos escuchado en diferentes momentos. Sin duda, fue una recomendación hecha por nuestros padres, y hoy vuelve a resonar cuando queremos emprender enormes proyectos de innovación e implementar las últimas novedades y tendencias tecnológicas en nuestras organizaciones. Muchos
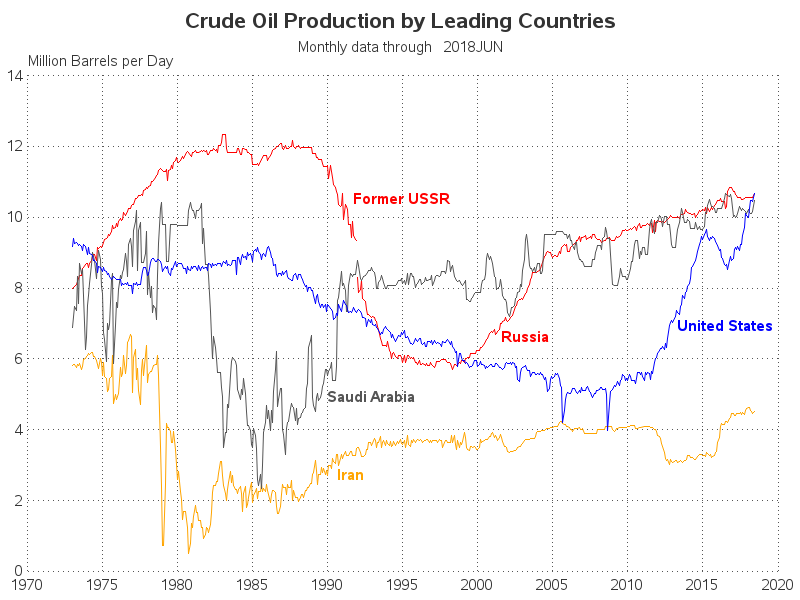
Over the years, the US has drilled for crude oil in several locations, such as Pennsylvania, Texas, Alaska, and the Gulf of Mexico. A few years ago, as the US started drilling more in North Dakota, there were forecasts that we would surpass Saudi Arabia in crude oil production. And recently,
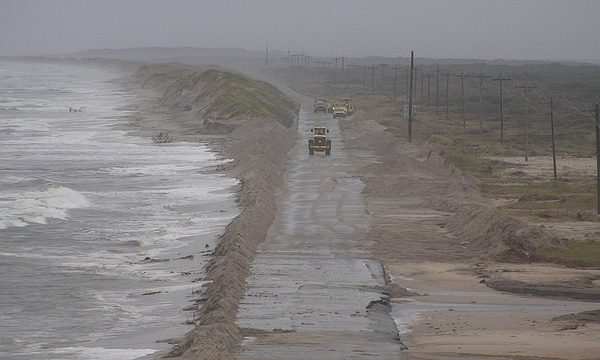

Once a disaster is over, and the frenzy of news stories and social media posts has subsided, it can seem like the crisis has passed. However, for those Hurricane Florence survivors left with ruined homes and businesses, damaged schools and buildings, there remains a struggle to return to normalcy. As