All Posts


Let’s be blunt. Procurement fraud is a problem. Orders and purchase procedures are one of the most vulnerable areas of corruption. The scale of irregularities and abuse in the procurement area is large. In fact, procurement fraud is the second-biggest economic crime after theft. Estimates suggest that businesses can

Have you ever wondered if love at first sight really exists? And if it exists, what qualities are people drawn too? Watch any romantic comedy and you’ll see this phenomenon play out on the big screen. Which begs the question, “If it can happen to them why not me?” Let’s

Education can change the future trajectory of generations. That is a fact we know to be true. But what does it really look like on a micro level, through the lens of an individual life? SAS employees like Ada Lopez demonstrate the transformative power of education. Ada spent most of her professional

As word spreads that SAS integrates with open source technologies, people are beginning to explore how to connect, interact with, and use SAS in new ways. More and more users are examining the possibilities and with this comes questions like: How do I code A, integrate B, and accomplish C?

SAS Global Forum 2019 (SGF) is rapidly approaching - and which of the hundreds of presentations are you planning to attend? Well, no matter what types of analyses you perform with SAS software, you'll most likely want to present your findings in a really nice/informative graph! Therefore I highly recommend


Suppose you need to assign 100 patients equally among 3 treatment groups in a clinical study. Obviously, an equal allocation is impossible because the second number does not evenly divide the first, but you can get close by assigning 34 patients to one group and 33 to the others. Mathematically,
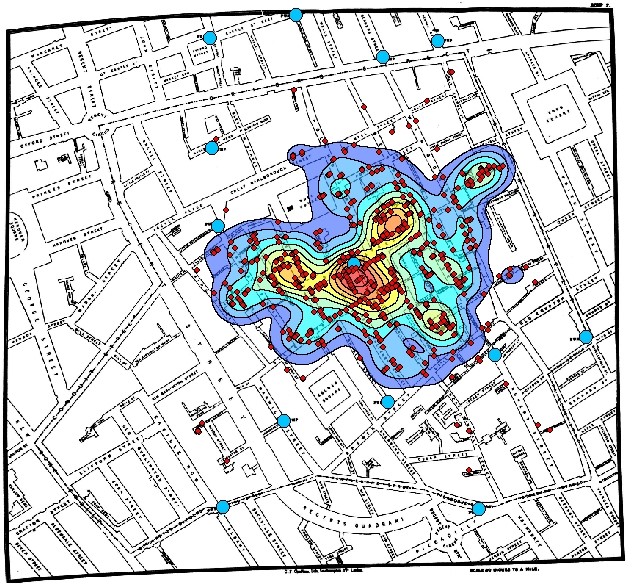

The catch phrase “everything happens somewhere” is increasingly common these days. That “somewhere” translates into a location on the Earth; a latitude and longitude. When one of these “somewhere’s” is combined with many other “somewhere’s”, you quickly have a robust spatial data set that becomes actionable with the right analytic

Recently, the North Carolina Human Trafficking Commission hosted a regional symposium to help strengthen North Carolina’s multidisciplinary response to human trafficking. One of the speakers shared an anecdote from a busy young woman with kids. She had returned home from work and was preparing for dinner; her young son wanted

Recently, you may have heard about the release of the new SAS Cloud. The platform allows fast access to data-science applications in the cloud! Running on the SAS Cloud and using the latest container technology, SAS Cloud eliminates the need to install, update, or maintain software or related infrastructure. SAS

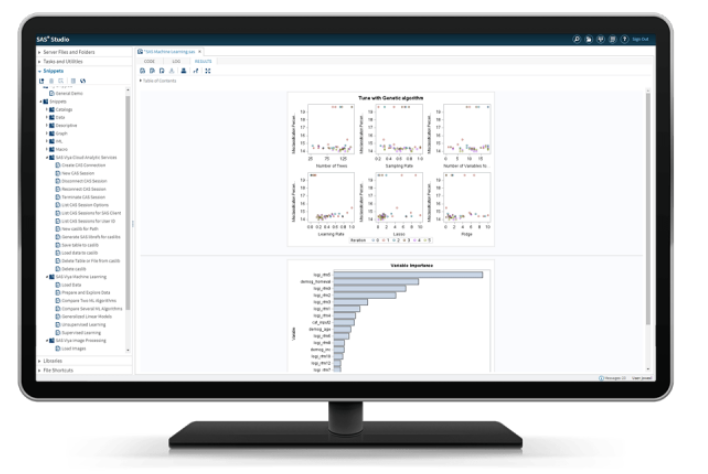
You are a data scientist, in your office, doing data scientist-y things when, your manager's, manager's, manager makes an impossible request. She wants you take a raw data set from the stem cell research team, scrub the data, create and score models, and be ready to rescore when new data


Have you ever dreamed of working for a professional sports organization? Do you play fantasy sports leagues and fantasize about owning a real team? Do you follow the news about player drafts and trades, and wish you could influence who your team picks? Well, here’s your chance. The latest SAS

When working with files like SAS programs, images, documents, logs, etc., we are used to accessing them in operating system directories. In Viya, many of these files are not stored on the file-system. Let's look at where and how files are stored in Viya, and how to manage them.


The idea of running software in a self-contained package took off with the launch of Docker in 2013 and has become a hot topic in the application development and DevOps community. In a recent survey by Red Hat, 57 percent of companies questioned said they use containers for some workloads


Changing how we’ve viewed the beautiful game forever. How often have we looked at a game and wondered, “How did he miss that?!” Now, with expected goals (xG) metric, we can really see if our frustration is justified, and perhaps use that to predict future results. The use of analytics

According to the World Cancer Research Fund, Breast cancer is one of the most common cancers worldwide, with 12.3% of new cancer patients in 2018 suffering from breast cancer. Early detection can significantly improve treatment value, however, the interpretation of cancer images heavily depends on the experience of doctors and technicians. The