All Posts
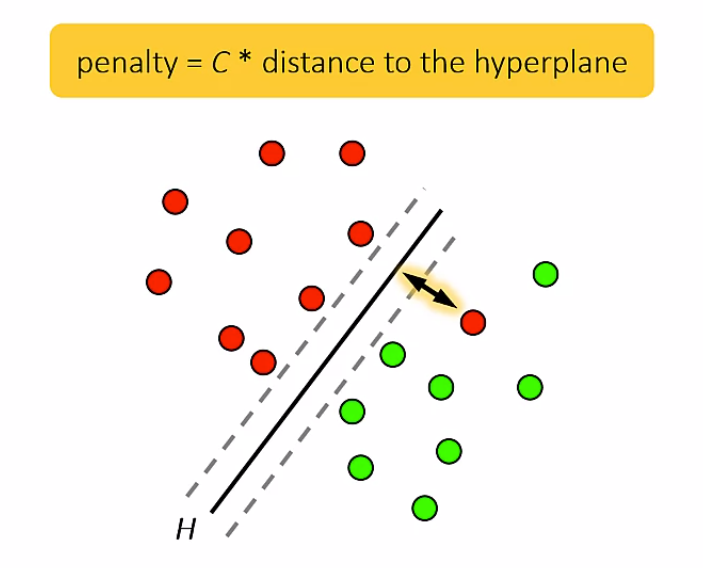
本記事では、SASのオンライン学習コース「Machine Learning Using SAS Viya」について引き続きご紹介します。このコースはGUI上で機械学習理論を学習できる無料のプログラムです。ご登録方法やWeek1・2については前々回の記事を、Week3・4については前回の記事をご参照ください。最終回となる本記事では、Support Vector Machineを扱うWeek5と、Model Deploymentを扱うWeek6をご紹介します。 Week5:Support Vector Machines Week1・2、Week3・4と同様に、通信事業会社の顧客解約率をテーマに機械学習の具体的手法について学習します。Week5ではサポートベクターマシンという手法を用い、解約可能性に基づき顧客を分類するモデルを作成します。 ・Building a Default Support Vector Machine Model Week5で扱うトピックはサポートベクターマシン(SVM)です。画像認識や文字認識、テキストマイニングで用いられることが多い手法で、複雑なパターンもフレキシブルに表現できるものの、結果の解釈が難しいという特徴を持ちます。分類問題に用いられることが多く、最も簡単な例としては、下の画像のように二種類の出力を分ける直線が挙げられます。この例では分類可能な直線は何通りも考えられますが、マージン最大化という手法を用いて最適な分類線を選択します。本セクションではこれらのSVMの基礎を学習しましょう。 ・Modifying the Model Methods of Solution 本セクションでは、あるデータセットが通常のSVMで分類できない場合に用いるソフトマージンという手法を学習します。通常のSVMとは異なり、この手法は分類の誤りをある範囲内で許容しますが、それぞれの誤りに対しペナルティを課します。合計のペナルティを最小化する境界を最適な分離平面とみなし、ラグランジュの未定係数法を用いて所望の境界を推定します。ペナルティに関するパラメータを変更しながら、モデルの性能を確認しましょう。 ・Modifying the Model Kernel Function 線形分離不可能なデータでも、ある写像により超平面での分離可能な高次元の特徴空間上の点に変換することでSVMが適用可能になります。この際、その特徴空間内における内積は、カーネル関数と呼ばれるものの評価に置き換えられる(カーネルトリック)という性質を用いると、計算量の爆発を防ぎSVMが実装可能です。このカーネル法を用いて、モデルの性能を改善してみましょう。SVMで扱うのはあくまで超平面であるため幾何的な解釈可能性があると言われるものの、多くの場合、依然として十分に複雑で結果の解釈が困難です。そこで解釈を助ける指標としてICEプロットや変数の重要度について学習します。 Week6:Model Deployment Week1~5ではデータの前処理やモデルの作成について学習してきました。最終回となるWeek6では、Analytics LifecycleのDeploymentの段階を学習します。 ・Model Comparison and Selection 今まで複数のモデルを学習してきましたが、すべての状況において最適なモデルは存在しません。様々な観点でモデル間比較を行い最も高性能なモデルをチャンピオンモデルとして採用します。主に数値的スコアに基づく比較が行われますが、その際、ROC曲線・AUC値を用いたモデル間性能比較や、ゲインチャート(CPHチャート)・LIFTチャートを用いたモデルの採用・不採用の間での比較などが行われます。これらの指標に加えて、ビジネスの文脈に応じ、学習や評価のスピード・実装可能性・ノイズへの頑健性・解釈可能性などを判断基準にすることも考えられます。 ・Model Scoring and Governance Week1ではData, Discovery, DeploymentからなるAnalytics Lifecycleの概要を学習しました。これまで顧客の解約予測モデルを作成してきましたが、Analyticsはそのモデルを使用して終わりではありません。ビジネスの状況は刻一刻と変化し、それに伴って新たなデータが蓄積されていきます。先ほど決定したチャンピオンモデルがいかに高性能であっても、一定期間後に同様の性能を持つかは決して自明ではなく、モデルのモニタリングを通して性能を逐一確認する必要があります。並行して、新たな状況に関してDataの段階から分析します。その際、新たなチャレンジャーモデルを作成し、現行のチャンピオンモデルとの性能比較によりモデルを改善する手法や、新たに入手したデータを用いて逐一モデルのパラメータを調整するオンラインアップデートという手法が用いて、モデルを高性能に維持します。モデル作成後も継続してDataやDiscoveryの作業を行うことが、Analytics
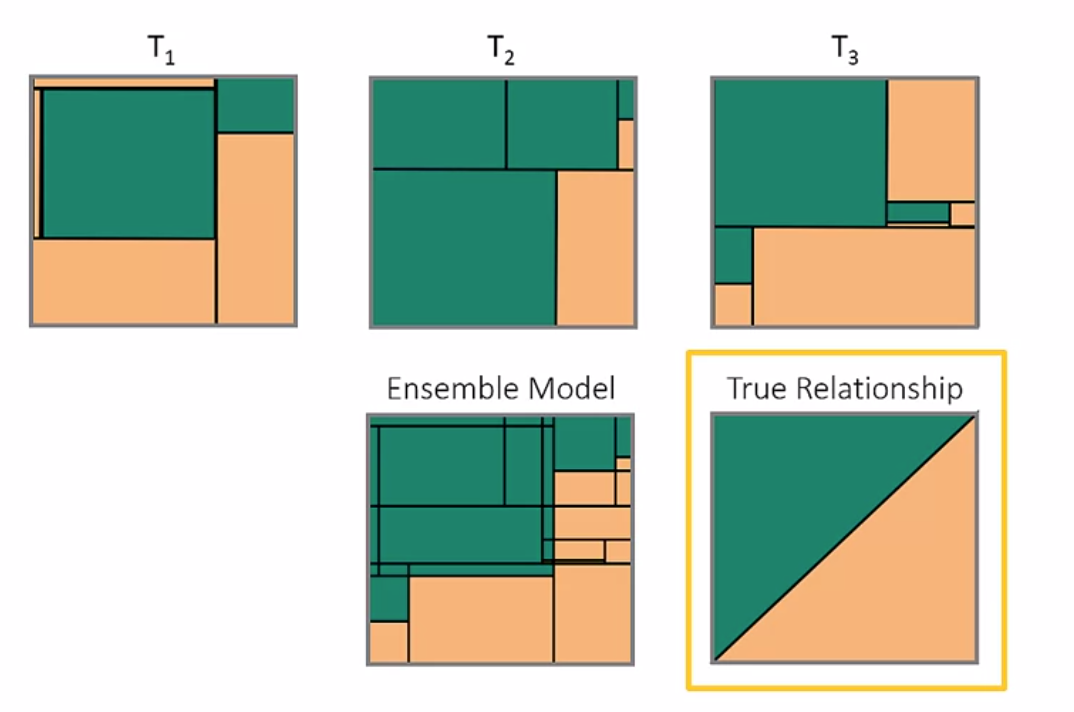
前回に引き続き、SASのオンライン学習コース、「Machine Learning Using SAS Viya」についてご紹介します。これはGUI上で機械学習理論を学習できる無料のプログラムです。ご登録方法やWeek1・2に関しては前回の記事をご参照ください。本記事ではWeek3・4の内容をご紹介します。Week3ではDecision Treeについて、Week4ではNeural Networkについて取り扱います。 Week3:Decision Tree and Ensemble of Trees Week1・2と同様に、通信事業会社の顧客解約率をテーマに機械学習の具体的手法について学習します。Week3では、ディシジョンツリーという手法を用いて、解約しそうな顧客を分類するモデルを作成します。 ・Building a Default Decision Tree Model Week3は右図のようなディシジョンツリーについて学習します。これは、図のように各ノードに与えらえた条件式に基づき入力データを分類するモデルです。結果の解釈が容易である点が大きな特徴ですが、オーバーフィッティングに陥りやすいという欠点もあります。デモを参考に基本的なディシジョンツリーを作成しましょう。 ・Modifying the Model Tree Structure ディシジョンツリーはパラメータとして木の構造を変更する事ができます。最大の深さや子ノードの数を変えると木の大きさが変わり、葉の最大要素数を減らすと分割が細かくなります。データの複雑さや過学習などの観点から各パラメータの及ぼす影響を学習し、実際に条件を変更して結果を比べてみましょう。 ・Modifying the Model Recursive Partitioning ディシジョンツリーの作成手順について学習します。まず、ある一つの集合を複数の集合へ分割する基準(不等式など)を作成します。この際、すべての分割方法を考え、その中から要素を最も適切にグループ化できる基準を選択します。例えば動物をグループ化する下の例については、多くの動物が混じっている上の状態よりも、シマウマの比率が高い下の状態のほうが適切とみなせます。ジニ係数やエントロピーを用いると、このような複数のグループの純度を数値的に比較できます。以上のようなグループ化手順を順々に繰り返し、最終的に一つの木構造を作成します。再帰的分割と言われるこの手法の詳細や、分割選択基準となるエントロピー・ジニ係数について学習し、ディシジョンツリーの理論的構造を把握しましょう。 ・Modifying the Model Pruning ディシジョンツリーは、サイズが過度に大きいとオーバーフィッティングを引き起こし、逆に過度に小さいと十分な汎化性能が得られません。そこで、まず最大のツリーを作成した後、重要でないノードを切り落としていくことでサイズを段階的に小さくし、最終的にバリデーションデータに対するスコアが最大となるサイズのツリーを採用します。プルーニングと言われるこの手法を実践しましょう。ツリーの大きさなどモデルに対して外部から設定する条件はハイパーパラメータと言われ、モデルの性能を高めるにはその最適化(チューニング)が不可欠ですが、本セクションではそれを自動的に行う手法も学習します。 ・Building and Modifying Ensembles of Trees ディシジョンツリーは入力データの影響を受けやすく、微小な変化に対しても大きく構造を変化させるため、安定した構造を取りません。しかし、一般にツリーの構造が変わったとしてもモデルの性能に大きな差が生じないという特徴があります。この性質を活用して、複数の構造のツリーを作成し、その結果を合わせて予測を行うアンサンブルという手法が用いられます。本セクションでは、その代表的手法であるバギング・ブースティング・勾配ブースティング・フォレストについて学習します。また、これらのモデルを実装し、チューニング後のスコアの比較を行います。 Week4: Neural


A cup of dark roast coffee, sunrise porch time, fresh sheets, a garden tomato, the smell of a new book, a glass of red fireside.....These are a few of my favorite things. All so simple, yet they bring me so much joy. Henry David Thoreau author, naturalist, philosopher, was born


Have you ever tried to pass comma-delimited values to SAS macro or to a SAS macro function? How can SAS distinguish commas separating parameters or arguments from commas separating parts of the values? Passing comma-delimited value as an argument to a SAS macro function Let’s say you want to extract


Organisations across the globe are caught in the midst of a digital revolution – one that has sent shockwaves rippling through every industry. Business leaders recognise the scale and pace of change: 68 per cent of executives surveyed by Accenture say that they expect their industry to be significantly disrupted


In the SAS/IML language, a matrix contains data of one type: numeric or character. If you want to create a SAS data set that contains mixed-type data (numeric and character), SAS/IML 15.1 provides support to write multiple matrices to a data set by using a single statement. Specifically, the CREATE


“Sharon” is overwhelmed by caring for her parents: both of their caregiving needs are increasing, she is weary from lack of sleep and fearful that her own health is in jeopardy. Her siblings live out of the area and seem unable to help. In addition to caring for her parents,
Last month I wrote a blog about sibling rivalry in caregiving which began with the following thoughts: 'As we are all well aware, providing caregiving for our parent(s) is complicated and messy. Siblings can often be both a blessing and a curse in this process, providing much needed relief and
As we are all well aware, providing caregiving for our parent(s) is complicated and messy. Siblings can often be both a blessing and a curse in this process, providing much needed relief and support, or perhaps creating additional stress and barriers to important decisions and resources. Why is this the


“They were the best of asteroids, they were the worst of asteroids.” ~ Charles Dickens Armstrong There are good asteroids, and there are bad asteroids. Good asteroids stay in their own neighborhoods and wait for us to come visit them. Bad asteroids, however, don’t wait for an invitation – they
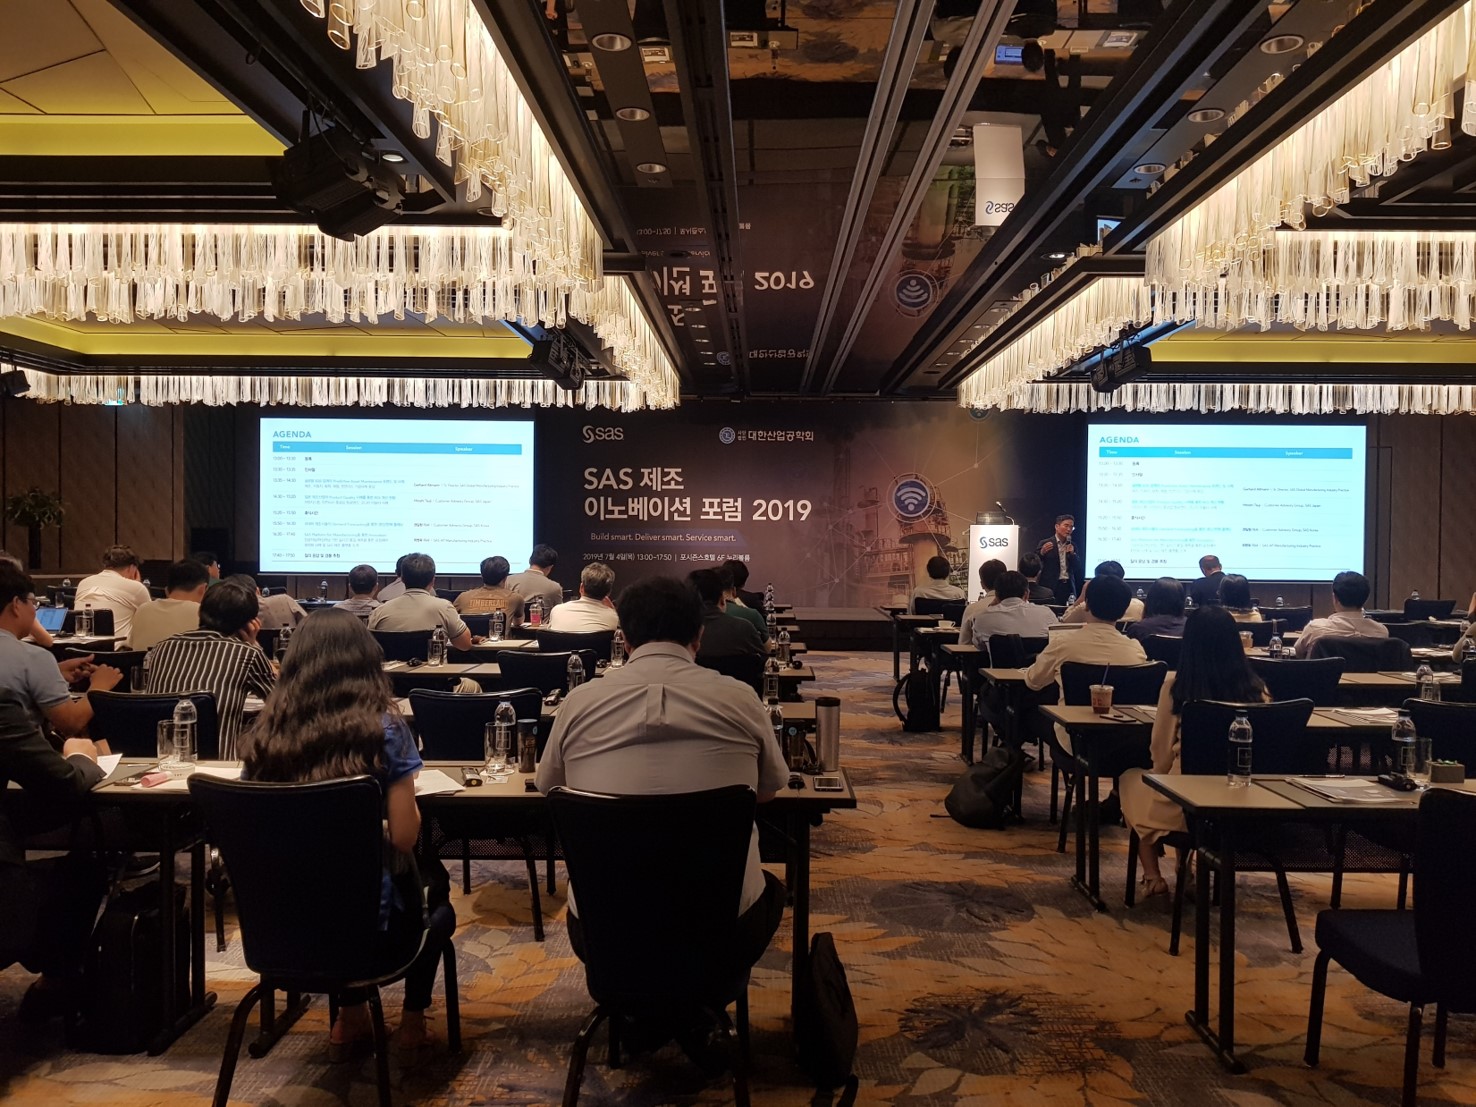

지난 7월 4일 SAS코리아는 광화문 포시즌스호텔에서 국내 제조 산업 관계자를 대상으로 ‘SAS 제조 이노베이션 포럼 2019(SAS Manufacturing Innovation Forum 2019)’을 성공적으로 개최했습니다. SAS는 이번 포럼에서 미국, 독일, 일본 및 국내 제조사들의 고객 사례를 통해 ▲글로벌 B2B 업계의 예측 자산 유지보수 ▲제품 품질 및 투자 수익(ROI) 개선 ▲수요 예측을 통한 생산/판매


A speaker at a recent major tech event quipped that “they will only call it AI until it is useful”. The point was that AI for the sake of AI is pointless, and can even be counter-productive. As soon as someone conceives and develops an actual use case, they name
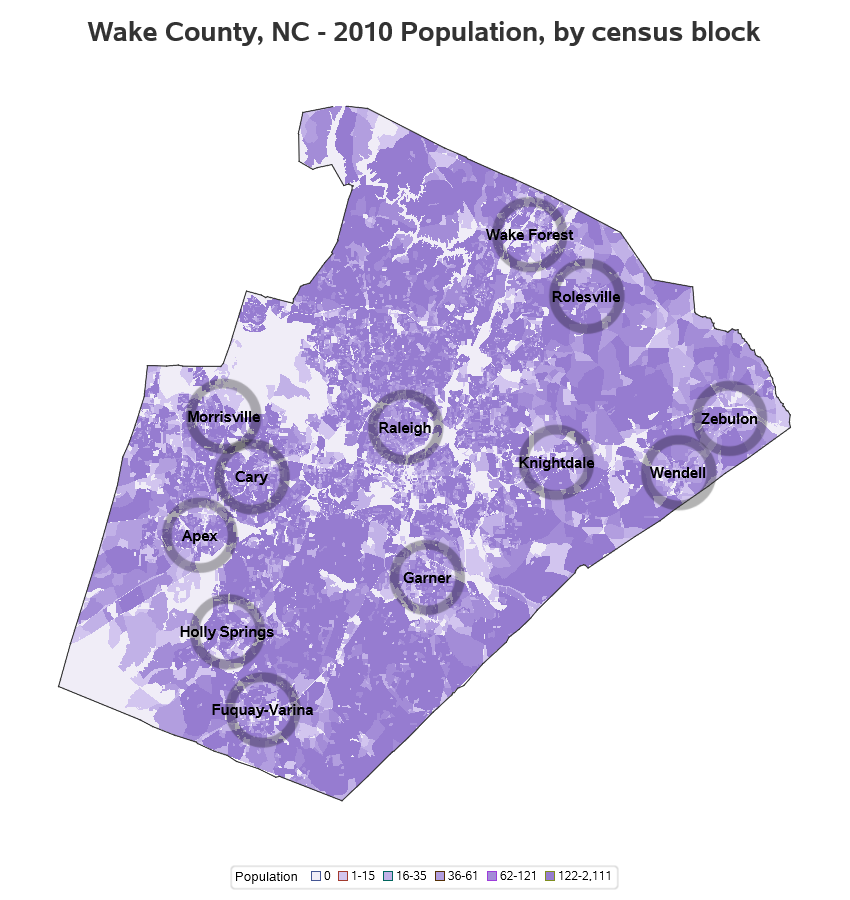

As the 2020 Census approaches, I'm getting my code ready to plot the data! And a question I often hear is "Can you use SAS software to plot data on a Census block map?" Rather than tell you 'yes', let me show you 'yes' :) Preparing the map First I

With all the excitement around SAS’ new software architecture, SAS Viya, we often get asked the question: What is it and how can it help my company conquer our analytics challenges? Fortunately, learning more about SAS Viya has never been easier. SAS Viya extends the SAS® Platform and provides reliable,


Here’s something you should know about Marvio Portela: He’s the kind of leader who’s not afraid to admit making a mistake. “I have had more than one life at SAS,” said Marvio, who explained that his first career at SAS began in 2010. “SAS is a place where you can