All Posts

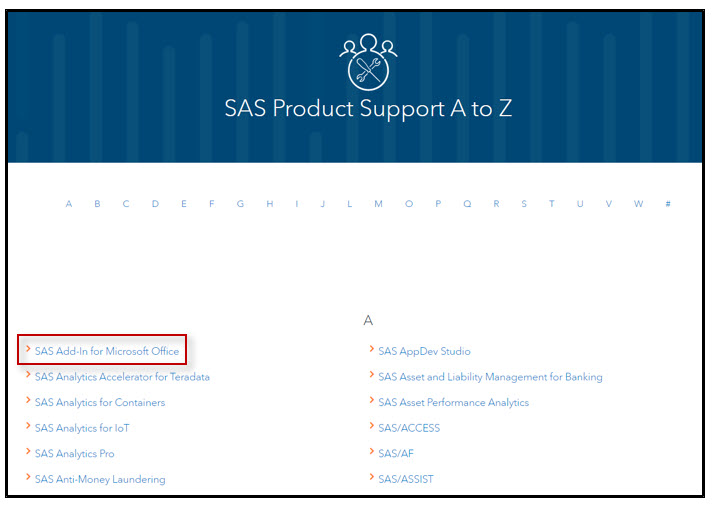
SAS Enterprise Guide(EG)で簡単にPythonなどオープンソース・コードを実行できる方法を紹介します。 1.オープンソースコード実行用タスク(OST)の概要 2.事前設定 3.EGでの使用方法 4.AMOでの使用方法 1.オープンソースコード実行用タスク(OST)の概要 SAS Enterprise Guide(EG)は直感的なユーザインタフェース上で、マウスの簡単操作で、透過的にデータにアクセスし、様々な分析用タスクを活用し、データの準備から加工・変換、集計・分析、レポート作成に至る一連の作業をグラフィカルなフロー図として描き、実行することができるツールです。 一方、多くの組織ではPython, Rなど様々なオープンソースのスキルを持つデータサイエンティストが混在することが多く、こうしたオープンソース(OS)とのコラボレーションも必要になってきています。従来、EGとPythonなどOSと連携する際には、データでのやりとりが必要でした。例えば、EGで作成したデータをエクスポートし、OSユーザに渡して処理してもらうか、その逆か、になります。 都度このようにデータをやりとりするには手間と時間がかかりますし、データやPythonコードなどの管理も課題となります。こうした課題を解決する手段の一つとして、カスタムタスクを活用することができます。 カスタムタスク:EGには、数多くのタスク(データ準備用タスク、分析用タスク、など)が実装されています。このタスクは顧客ニーズに応じてカスタムで作成し、活用することができるようになっています。SASのサポートサイトからカスタムタスクを作成するためのテンプレートをダウンロードし、使用することができるようになっています。カスタムタスクの作成方法の詳細に関しては、次回のブログでご紹介します。 オープンソースコード実行用タスク(OST):OSTはOpenSourceTaskの略で、EGカスタムタスクのテンプレートに基づいて開発されています。OSTを使用することで、EG上で簡単にPythonコードを実行することができ、GUIベースの簡単マウス操作でPythonコードを再利用し、EG上で、標準実装のタスクとOSTを活用し、連携してアナリティクス作業を完結することができます。これによって、様々異なる分析スキル(GUIユーザー、SAS言語ユーザー、OS言語ユーザー)を連携し、有効活用することが可能となります。また、この分析処理は自動化することも可能です。 次にPythonコード実行用のOSTの使用方法を紹介します。EGのバージョンは8.2を使用したものです。 2.事前設定 ・Python環境の確認 まずSAS9サーバ側にPython環境がインストールされていることを確認してください。Pythonの環境がない場合は、PythonまたAnacondaなどPythonのruntimeをインストールする必要があります。 ・SAS9サーバーの設定 SAS9のSMC(SAS Management Console)を起動し、以下の画面を開きます。 「Environment Management」>「Server Manager」> 「SASApp」>「SASApp Logical Workspace Server」>「SASApp - Workspace」を右クリックし、「Properties」をクリックし 以下の設定でXCMDの実行を許可します。 「Options」タブ >「Advanced Options」>「Launch Properties」で「Allow XCMD」をチェックし、「OK」をクリックします。 設定を有効するにはシステムのObject Spawnerのサービスを再起動する必要があります。 ・OSTパッケージの取り込み OSTパッケージをダウンロードし、展開したCustomフォルダをEG(またAMO)のインストール先(以下画面ショットのロケーション)にコピーします。そのほか、臨時ファイル保存と作業用フォルダC:/Customを作成し、準備作業が完了です。 これで、OSTが使用できる状態になります。 3.EG上の使用方法 まず EGを起動し、処理対象データを選択します。今回はSASHELPライブラリ内にある「CLASS」を選びます。データを選択した状態で、タスクリストのSAS


2019년 12월, 중국을 시작으로 발생한 코로나바이러스감염증-19(COVID-19)가 전 세계로 확산되며 190개 국가에서 32만명이 넘는 확진 환자가 발생했습니다. (2020년 3월 23일 기준) 세계보건기구(WHO)는 3월 11일 감염 확산세가 지속되자 홍콩독감(1968), 신종플루(2009)에 이어 사상 세 번째로 코로나19에 대해 팬데믹(pandemic; 세계적 대유행)을 선포했는데요. 한국 역시 지난 2월 23일 코로나19 대응 수준이 ‘심각’ 단계로 격상되며 확진자가
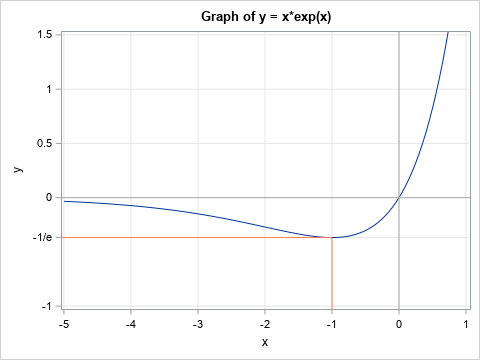

When you create a graph by using the SGPLOT procedure in SAS, usually the default tick locations are acceptable. Sometimes, however, you might want to specify a set of custom tick values for one or both axes. This article shows three examples: Specify evenly spaced values. Specify tick values that


Los negocios buscan ofrecer una experiencia continua y fluida a sus clientes. Es responsabilidad de los líderes de mercadotecnia enfocar sus esfuerzos en saber cómo aportarán este valor en la atención a sus mercados y, por consiguiente, generar nuevos ingresos, entre otros objetivos de las organizaciones, como ofrecer una experiencia

Martin Mincey of SAS Technical Support shows you how to debug when listing registered SAS fonts, registering new fonts, getting SAS SG procedures to use a new font and more.
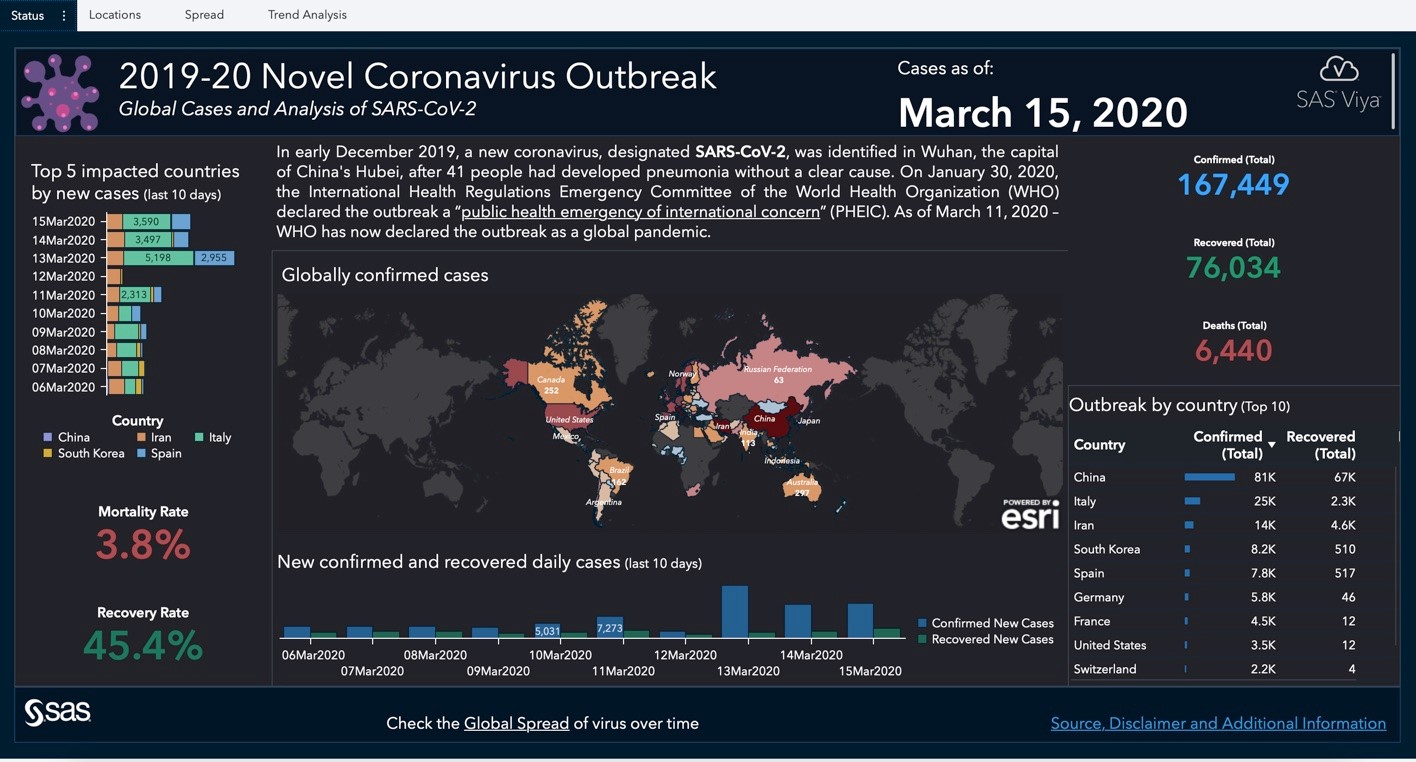
인류의 건강을 위협하는 문제, 특히 코로나바이러스(COVID-19)처럼 빠르게 전파되는 질병이 확산되는 초기 단계에는 예상할 수 없는 많은 변수들이 존재합니다. 이러한 단계에서 데이터 시각화를 활용하면 빠르게 추세를 파악하고 단편적인 데이터들로부터 유의미한 결과를 도출할 수 있습니다. 바이러스 경로 시각화는 사람들에게 경각심을 일깨우고 바이러스의 영향력을 알림으로써, 궁극적으로 질병 예방 활동에 도움이 될 수 있을


Watch list screening has been one of the rules with highest false-positive rate. Watch list screening has been one of the pillars for know your customer (KYC) and anti-money laundering (AML) regulatory requirements since the beginning. It was introduced to prevent known criminals (or known high risk entities) from utilizing


At SAS Press, we agree with the saying “The best things in life are free.” And one of the best things in life is knowledge. That’s why we offer free e-books to help you learn SAS or improve your skills. In this blog post, we will introduce you to one


Work/Life wanted to know the creative ways SAS employees are coping with the temporary changes caused by Coronavirus precautions. We asked how you are coping with working from home, working from home with kids, keeping entertained at home, and how you are staying centered and connected with others. Here is


Analytics makes it possible to uncover complex or organized fraud that rules-based systems would miss.


Il Risk Management è un tema centrale nel settore finanziario e se questo fosse uno dei soliti articoli dedicati al Risk Management, allora adesso dovremmo parlare della crisi del 2008, di come le autorità bancarie abbiano reagito, di quali rischi debbano essere gestiti in modo efficace, e così via. Questo,

Let’s be honest, there is a lot of SAS content available on the web. Sometimes it gets difficult to navigate through everything to find what you need, especially if you are looking for complimentary resources. Training budgets can be limited or already used for the year, but you’re still interested
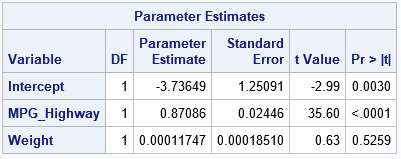
A SAS/IML programmer asked about the best way to print multiple SAS/IML variables when each variable needs a different format. He wanted the output to resemble the "Parameter Estimates" table that is produced by PROC REG and other SAS/STAT procedures. This article shows four ways to print SAS/IML vectors in


And as survey fatigue kicks in, challenges in customer satisfaction and NPS scoring abound: will data be still representative or will it become increasingly biased?


Data management has never been the shiny object that caught the imagination of the mainstream. And let’s be honest, it's not nearly as interesting as analytics, machine learning or artificial intelligence. In fact, entire movies get created about analytics, and people actually pay to see them! Data management? Not so