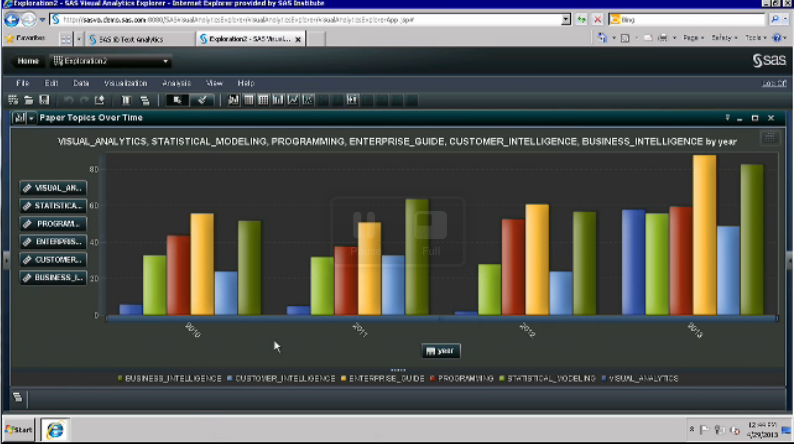
Was ist das nur mit diesen iPads, "Samsungs", Galaxy Tablets und wie sie alle heißen? Keine Tastatur, kleiner Bildschirm und trotzdem will jeder ein Tablet haben. Wenn ich in meinem SAS Visual Analytics Kursen, die meines Erachtens unglaublich gelungenen und höchst intuitiven Data-Exploration- und Report-Möglichkeiten mit meinem Laptop zeige, so
Search Results: Visual Analytics (1744)
If you've watched any of the demos for SAS Visual Analytics (or even tried it yourself!), you have probably seen this nifty exploration of multiple measures. It's a way to look at how multiple measures are correlated with one another, using a diagonal heat map chart. The "stronger" the color
The Data Visualization Charting 101 seriesexplores different tools to visualize data. Check out other posts to see which data visualization is right for you. My grandmother often used the saying “as the crow flies” when giving directions, referring to a straight line being the shortest distance between two points. When
At SAS, one of our core values is to be swift and agile. So it makes sense that our software development be Agile too. The Agile methodology has been around for more than 10 years and was designed with software development in mind. Today, it is still used predominately for
"And the winner is…" Ob der Branchen-Oskar für wirksame Marktkommunikationen, der "GWA Effie", oder die "Löwen von Cannes" für inspirierende Kreativität: Im Frühsommer ist es traditionell wieder an der Zeit, Preise zu verleihen* in der Marketing- und Werbebranche! Sicher: Kreative Leistungen und erfolgreiche Zielgruppenansprachen in klassischen Medien, im Online-Bereich oder im
The Data Visualization Charting 101 series explores different tools to visualize data. Check out other posts to see which data visualization is right for you. Have so much data that your head is spinning? If you have a lot of data that needs to be visualized, a scatter plot, aka
San Francisco! The Bay Area and Silicon Valley: innovation, the brightest minds, creating, inspiring new technology and style. This city is known for its healthy food choices. For example, I spotted a homeless man on my way from the Westin St. Francis to the Moscone Conference Center with this never-
I’m a geek at heart – I always have been and I always will be. I love technology and I love math. I love that my job combines both. But you know what is even better? In today’s world of big data and data visualization, it is totally fashionable to
In today's fast-paced, jam-packed work day, many people answer email and read reports after business hours. And more and more, they're doing those things on a smartphone or tablet. How are your users accessing and using your reports? Statistics South Africa has found that their end-users would prefer a mobile
Even though it's been around for well over a decade, SAS Enterprise Guide was still a hot topic among attendees at SAS Global Forum this year. In the Technology Connection -- the big session on Monday morning -- SAS R&D staff used the conference agenda content to demonstrate the power
When users attend SAS Global Forum, they often look forward to hearing from the big names of SAS. To name a few: CEO Jim Goodnight, VP and CMO Jim Davis, and Co-Founder John Sall. Inside SAS Global Forum caught up with these busy executives on the demo floor to talk about SAS
Google holds the gold standard for maps and we have heard our users loud and clear. SAS will introduce enhanced mapping features in SAS Visual Analytics Explorer, SAS/GRAPH®, and other products.
The Data Visualization Charting 101 series explores different tools to visualize data. Check out other posts to see which data visualization is right for you. What comes to mind when you hear the word bubbles? I think of the fact that it’s getting warmer outside and prime time for my
Reading the latest issue of Intelligence Quarterly magazine has really brought home to me the limits of our human brain and its selective processing. Think about it: visualise a London bus in your mind. Even though you see them every day or have at least seen pictures, are you able
Enthusiastic SAS Global Forum users flocked to the SAS Business Intelligence Development Roundtable for an interactive panel discussion on the current BI and reporting solutions portfolio including SAS Enterprise BI Server, SAS Enterprise Guide, SAS Mobile BI and SAS Visual Analytics and the future focus of the products. Panelists included SAS representatives from Product
“Faster, Higher, Stronger” is the Olympic motto. In a Keynote Lunch presentation at SAS Global Forum, Tim Patrick, Director of Enterprise Applications for the United States Olympic Committee, explained how technology, data analysis and visualization are helping fulfill that mission. After a successful showing at the Vancouver games, Patrick and
Couldn’t make SAS Global Forum in person this week? You don’t have to miss out on any of the great news announcements being made in San Francisco. Here’s a quick rundown. At SAS we have big data on the brain, and SAS Global Forum is our opportunity to showcase SAS
Jim Goodnight kicks off SAS Global Forum with a look back the first SAS visit to San Francisco in 1982 - when everything was big including hair, cell phones and computers! Now, small computers deliver big data and we can access that data on even smaller devices such cell phones
There's nothing like SAS Global Forum and no place like San Francisco! Everyone around me is packing up cameras and notebooks, including SAS' roving reporter Anna Brown. For those who can't make it this year, Anna's Inside SAS Global Forum video series is the next best thing to being there.
Even if you cannot attend SAS Global Forum next week, you can experience it virtually via the Livestream sessions. This year I will reprise my role as host of SAS Tech Talks, a pair of live webcasts that feature SAS R&D professionals and their latest technological wares. Click "play" on
It’s that time of year again, where I make my plans to head to SAS Global Forum. This year, the meeting is in San Francisco and, since I love this city, it makes me more excited than ever to meet with SAS friends. This user conference is planned and organized
The Data Visualization Charting 101 series explores different tools to visualize data. Check out other posts to see which data visualization is right for you. The most delicious of all charts is the pie chart. I recall a recent TV show where a character made a bar chart of his favorite
Last night's Horizon programme entitled The Age of Big Data (BBC2) highlighted the ongoing explosion of information and how it is transforming the way we interact with the modern world. From predictive policing to mapping the solar system, big data is shaping how organisations understand the environment to make smarter,
I worked at the General Dynamics (now Lockheed-Martin) F-16 jet fighter plant in Fort Worth, Texas, during the mid-1980’s, where they subsequently manufactured the F-22 and now the F-35. My tenure there spanned the era of the $400 hammer and $700 toilet seat scandals in the military procurement world. While
Last week I delivered a SAS Talks session: Introduction to Custom Tasks for SAS Enterprise Guide (click to watch it). I promised that I would share a collection of resources where you can learn more information. First, here is a round-up of the custom tasks that I mentioned, with links
Der 21.12.2012 liegt einen Monat zurück und Sie können diesen Beitrag lesen. Das bedeutet: Wahrscheinlich ist die Welt auch in Ihrer Region nicht untergegangen. Und wie so oft, haben wir auch das souverän vorhergesehen. Mit der Vorhersage von Ereignissen ist das so eine Sache: Wir glauben, dass wir uns besser
Organizations must find the right balance between tactical use of their data and strategic use of their data. The following statement encapsulates the difference between an application that was primarily designed from a tactical perspective versus a strategic one.: "Thanks, you delivered what I asked for (tactical), but not what I
In case you are wondering, yes, I am reusing the same graphic from last week, but this time to make a contrasting point. Last time, in “The Skeptical CFO” I was focused on the VARIABILITY in the data and the forecast. This week, however, we’re headed in the opposite direction,
Sigurd Hermansen, from Westat, got his idea for breaking big data into small pieces after watching Jim Goodnight dissect a blade server to show the power high-performance analytics has processing for big data. Goodnight also demonstrated how Visual Analytics Explorer transfers the data from the servers to a workstation and
When SAS CEO Jim Goodnight talks about the development of SAS High-Performance Analytics, he always starts with the customer. After all, it was banking customer UOB in Singapore that first approached Goodnight three years ago about reducing the time it took to calculate risk factors on the bank's full portfolio.