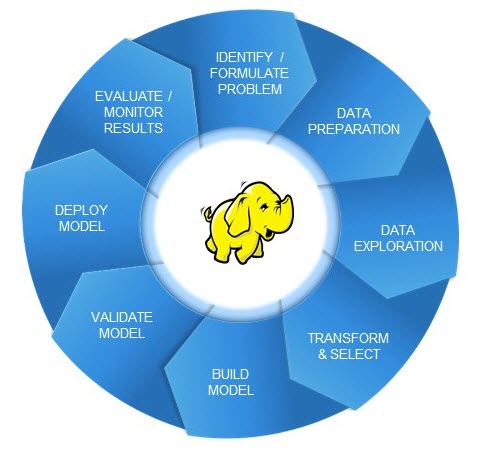
As a blogger, I often wonder whether my blog posts are 'successful' - and being a graph guy, I like to visually analyze the data, to try to answer that question. The most common measure of a blog post is probably the number of times it was viewed, so I guess
Search Results: Visual Analytics (1744)
Cloud Computing hat (zum Glück) den Hype schon hinter sich und wird nun langsam 'erwachsen' (auch wenn das z.T. noch mit langen Wartungsfenstern passiert...). Zeit einmal nachzusehen was denn eigentlich SAS so alles in diesem Umfeld macht.
Special Investigation Units (SIU) are extremely process-oriented and follow well-documented procedures to decide when a claim should be referred for investigation and what actions should be taken. Most of the staff are seasoned investigators who may be more inclined to trust their experience and tried-and-true processes than analytical techniques that
The physical and social costs of untreated mental illness are significant and have been discussed in detail in previous posts. Now let’s talk about the immense financial costs, then I’ll wrap up the series with a conclusion. The financial costs cover a broad cross-section of society, including government services and
Flexibility and nimbleness are terms synonymous with small and mid-sized businesses. They have the ability to react quickly to changing market conditions as they are made aware of them. Traditionally these businesses have lived in the world of spreadsheets - and why not? They are easy to use, very affordable
In case you haven’t read about SAS Visual Statistics, let’s start with a quick overview. First, it’s an add-on to SAS Visual Analytics. Second, it’s a web-based solution with an interactive, drag-and-drop interface that helps you rapidly build descriptive and predictive models. Lastly, SAS Visual Analytics and SAS Visual Statistics
We are in the age of big data. But just because modern software makes it easy to handle large data volumes, it's worth asking: do you always need all that data? In other words, if your analytics software can accommodate and even thrive in this big data environment, does that mean
Well, this is a kick to the giblets. I assumed when I was summoned to the White House it was in recognition of my tireless advocacy for turkey rights. I wasn’t expecting a press conference in the rose garden or anything, just a meet and greet with the prez and
When it comes to fraud detection and risk mitigation, predictive modeling has earned a reputation as the “heavy hitter” in the realm of data analytics. As our celebration of International Fraud Awareness Week continues, I would challenge our readers to ask themselves this question, “Is the reliance upon predictive analytics
Many vendors claim they have analytics, and a lot of users have embraced the belief that analytics is the way to go. But what does analytics really mean, especially to business users without statistics backgrounds, and how much do they need to know about analytics to be able to make
Greetings, insignificant souls. You may call me … Gregor Castamere. It is not my true name. I stalked this strip of land when it was called New Amsterdam. My family’s name is well known. I have lived for more than 600 years, concealing my terrible secret. I am a vampire.
In this post we dig deeper into the fourth recommended practice for securing the SAS-Hadoop environment through Kerberos authentication: When configuring SAS and Hadoop jointly in a high-performance environment, ensure that all SAS servers are recognized by Kerberos. Before explaining the complex steps in connecting to secure Hadoop within a
Visual analytics es una solución, que puede impactar los resultados de una compañía independientemente del tamaño. Según Sanjeev Aggarwal, socio de la consultora tecnológica SMB Group, esta solución es el futuro del análisis avanzado de datos para las empresas en crecimiento. Las hojas de cálculo y las herramientas de Business Intelligence tradicionales
One of the hottest trends today in the business intelligence and analytics spaces is “self-service.” The word self-service is thrown around lightly in many situations and often carries different expectations for different people and organizations. Before we go into the details of self-service analytics it is important to have a
So, you've heard the Hadoop hype and you are looking – or have already invested – into Hadoop. Maybe you have also realized some benefits from the Hadoop ecosystem. But now you want to maximize those benefits by using advanced analytics, or you might have heard about algorithms or machine learning libraries available
I’m sure, like me, you've been annoyed at being stuck in a traffic jam in a city centre somewhere, or been frustrated at your kids leaving lights on, or annoyed with the heating coming on when the weather’s warmed up and you've not got round to adjusting the thermostat. Now,
Norwegen-Kreuzfahrten befriedigen recht homogene Urlaubsbedürfnisse. Nicht selten werden diese offensiv nach außen getragen: Die Dichte an hochwertigen DSLR-Kameras und großen Teleobjektiven spricht dazu ihre eigene Sprache. Es handelt sich daher um keine wackelige Hypothese, dass für ein großes Urlaubersegment ambitionierte Aufnahmen der Fjordlandschaften ein Kernbedürfnis darstellen (s. Beweisstück A).
We’re not sure about you, but we just had the most thrilling, suspenseful, and fun month we’ve had in a while. The 2014 FIFA World Cup may be over, but we’re still amazed by not only the game outcomes and level of athleticism, but also by the wealth of interesting
When I started working at business analytics leader SAS, I had no idea I’d be helping the Great Britain Rowing Team plot their way to Olympic glory. While I haven’t, yet, got in a boat and started rowing, I have started working with them on how they can make better
Data visualization tools are a great way to create impactful reports. A well designed report can give users an understanding of their data quickly and easily. And with tools like SAS® Visual Analytics, users can now quickly visualize and understand vast amounts of data. However, with all the visualization options
Visual analytics es una solución, que puede impactar los resultados de una compañía independientemente del tamaño. Según Sanjeev Aggarwal, socio de la consultora tecnológica SMB Group, Visual analytics es el futuro del análisis avanzado de datos para las empresas en crecimiento. Las hojas de cálculo y las herramientas de Business
In the energy industry, oil and gas companies as well as utilities are struggling with many changes at once. First, they're facing what the oil and gas industry has coined "the big crew change," meaning the retirement of those with the most skills and experience on how to run their
Insights from decision trees and other basic analytic techniques show that you don’t always need complex analytics to solve business problems and add value. This was the message from Dr. James (Jim) Foster, Director of Research and Process Development, Archer Daniels Midland (ADM), at last month’s inaugural IE Group ‘Manufacturing Analytics
Do you ever look at a chart or graph and think about what it’s really trying to reveal? All the time, right? Visualizations are useful because they allow us to analyze information much quicker than if we were to look at the raw data by itself. I say this with
What if you could rank where you stand versus your industry peers when it comes to how effectively you're making use of your data through analytics? Now you can. Jim Davis, Senior Vice President and Chief Marketing Officer at SAS, outlined an eight-metric test at today’s Premier Business Leadership Series
¿Alguna vez ha imaginado una nave roja futurista que aterrizó en medio del desierto? Así es como se ve el mayor tejado de aluminio pre revestido del mundo: El parque temático cubierto Ferrari World en Abu Dabi, Emiratos Árabes Unidos. Ahora fíjese en la extraordinaria resistencia del color en este techo
Hoy en día la visualización de datos está siendo el tema central cuando hablamos de big data, analítica e inteligencia de negocios. El tamaño, la velocidad y la variedad de sus datos están creciendo cada vez más rápido, y el mundo del análisis avanzado está cambiando, ¡su compañía no se
"30 Prozent der Unternehmen haben bereits Big-Data-Initiativen" - so eines der Ergebnisse der gerade vorgestellten Studie "Big Data Analytics" des Analystenhauses BARC. Die Experten von BARC haben Unternehmen in der gesamten DACH-Region befragt und zeichnen ein aktuelles Bild des Status quo: Fast ein Drittel aller Unternehmen gibt wenig auf Pauschalurteile
Gerne erinnere ich mich noch an die Zeit, als ich mit dem Begriff Memory zunächst nur ein einfaches Kartenspiel assoziert habe. Diese frühe Form des "Gehirnjoggings" hat mich übrigens nie besonders lange begeistert. Ähnlich begrenzt wie meine Geduld damals sind heute viele Hardware-Systeme in Bezug auf die wachsenden Anforderungen. Zwar wächst
From Gartner to IDC to the trade press, the watchwords in the supply chain for rest of this decade appear to be “resiliency” and “responsiveness”. It’s not going to be about promotion-based pull-through, and it’s most definitely not going to be about channel incentive-based push-through. What it’s going to be