
Unmasking the faces of fraud to protect your data

Stu Bradley discusses the importance of education, diligence and analytics in the fight against fraud.
Stu Bradley discusses the importance of education, diligence and analytics in the fight against fraud.
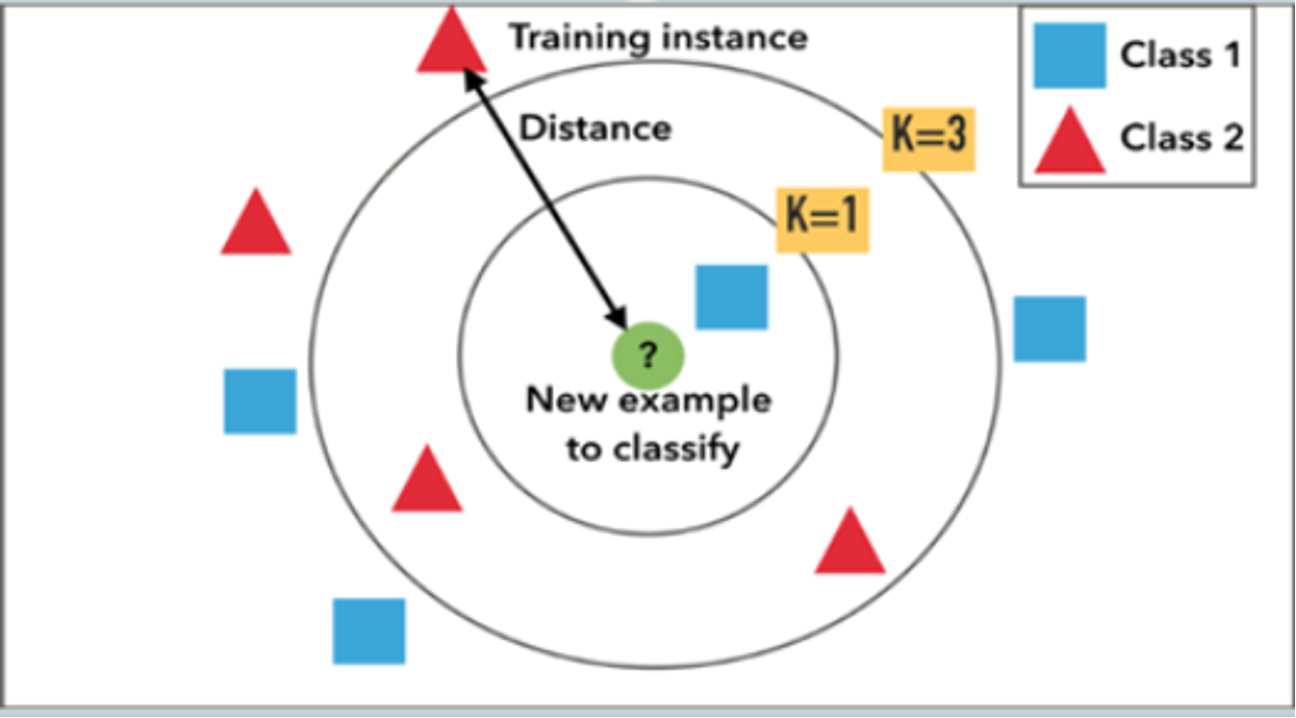
K Nearest Neighbour is an algorithm that stores all the available observations and classifies the new data based on a similarity measure.
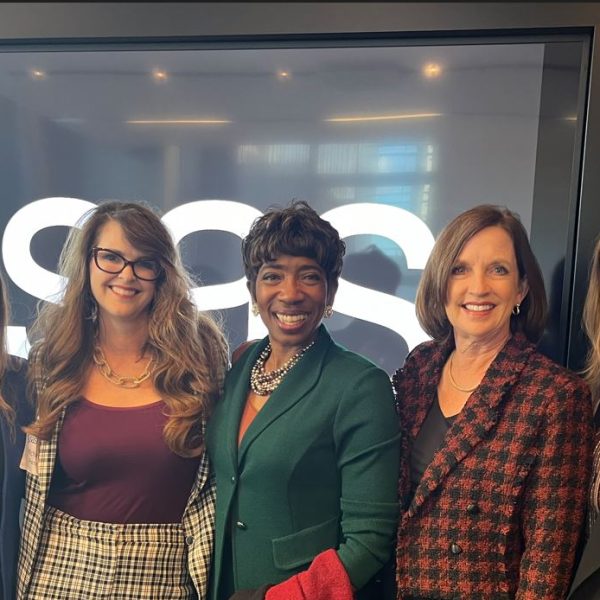
Inspiring discussions with Carla Harris and fellow executives in the heart of NYC. In October, leaders from SAS and other organizations in life sciences, health care, and health care-focused finance participated in a transformative leadership event. This experience left a lasting impression. The event was the kickoff of SAS’ first