Banking in 2024: Now is not the time (or is it?)

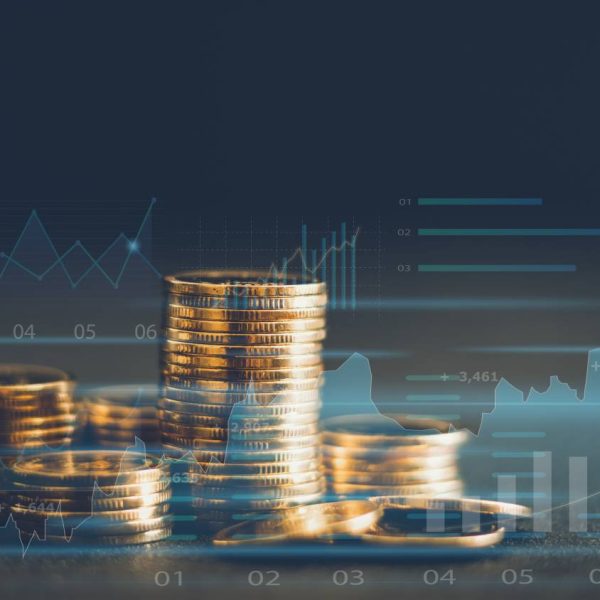
Despite the wild ride and changing market conditions of the past few years, global banking has proven to be largely resilient and generally sees a more positive outlook. Inflationary pressures have brought the “low for long” interest rate era to an end (or at least to a sustained pause), allowing