
2024 SAS Customer Recognition Awards – It’s Time to Vote!

Cast your vote by Friday, Feb. 2 to determine winners of the 2024 SAS Customer Recognition Awards.
Cast your vote by Friday, Feb. 2 to determine winners of the 2024 SAS Customer Recognition Awards.
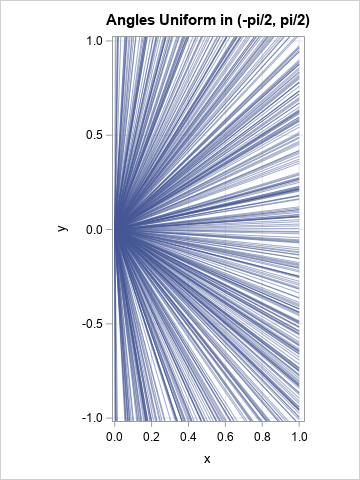
There are two popular ways to express the steepness of a line or ray. The most-often used mathematical definition is from high-school math where the slope is defined as "rise over run." A second way is to report the angle of inclination to the horizontal, as introduced in basic trigonometry.
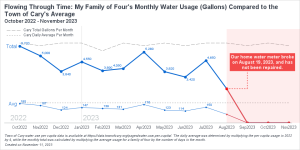
Have you ever been curious about your monthly water consumption and how it compares to others in your community? Recently, I had this question and decided to get ahold of my family's water usage data for analysis. Harnessing the power of data visualization, I compared my family of four's monthly

