In my previous article on Adverse Event Timeline Graph, I wrote about how to create the AE timeline using SAS 9.2 code, using VECTOR plot and the MARKERCHAR option in SCATTER plot. I described a better way to place the labels at the lower end of the vectors.
SAS 9.3 provides an easier way to create such graphs using the HIGHLOW plot statement that supports placing labels and end caps at the low end or high end of each bar. The plot does all the work needed to figure out the position, and so the code is very simple.
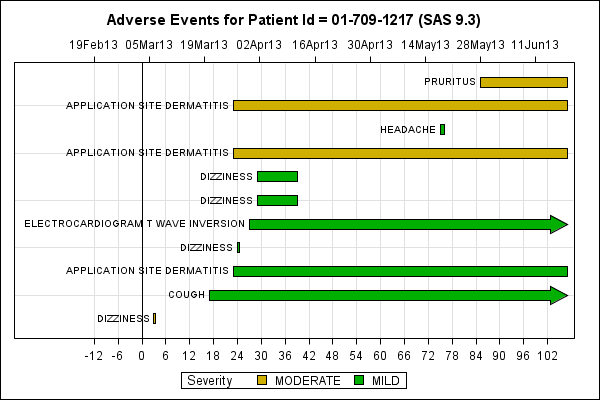
Here is the graph and the SAS9.3 SGPLOT code:
SAS 9.3 SGPLOT Code:
title "Adverse Events for Patient Id = &pid (SAS 9.3)"; proc sgplot data=AE_Cap dattrmap=attrmap; format aestdate date7.; refline 0 / axis=x lineattrs=(color=black); highlow y=aeseq low=aestdy high=aeendy / type=bar group=aesev barwidth=0.8 lowlabel=aedecod lineattrs=(color=black pattern=solid) highcap=aehicap attrid=Severity; scatter y=aeseq x=aestdate / x2axis markerattrs=(size=0); xaxis grid display=(nolabel) offsetmax=0.02 values=(&minday2 to &maxday by 2); x2axis display=(nolabel) offsetmax=0.02 values=(&mindate2 to &maxdate); yaxis grid display=(noticks novalues nolabel); run; |
As you can see in the graph above, the adverse events are displayed by sequence, and multiple events of the same name (such as DIZZINESS) are displayed independently with the name displayed. It is not clear to me why this data set has two events for DIZZINESS and DERMATITIS for the same duration. Clearly, the data needs cleaning. The events that do not have an end date have a arrow cap at the top end.
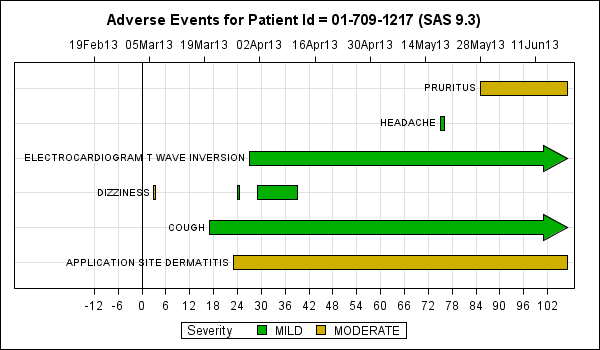
A reader asked whether it was possible to show all events of the same name on one line. The answer is yes, and we can do that by creating the graph by AEDECOD instead of AESEQ. The only thing we have to do is avoid having the label displayed multiple times.
To do this, I create a new variable that I call AENAME. This variable has the same values as AEDECOD for all first occurrences of the event. For subsequent occurrences of the same name, AENAME has a missing value. Here is the graph and the code.
SAS 9.3 SGPLOT code:
title "Adverse Events for Patient Id = &pid (SAS 9.3)"; proc sgplot data=ae_by_name dattrmap=attrmap; format aestdate date7.; refline 0 / axis=x lineattrs=(color=black); highlow y=aedecod low=aestdy high=aeendy / type=bar group=aesev barwidth=0.8 lowlabel=aenamelineattrs=(color=black pattern=solid) highcap=aehicap attrid=Severity; scatter y=aedecod x=aestdate / x2axis markerattrs=(size=0); xaxis grid display=(nolabel) offsetmax=0.02 values=(&minday2 to &maxday by 2); x2axis display=(nolabel) offsetmax=0.02 values=(&mindate2 to &maxdate); yaxis grid display=(noticks novalues nolabel); run; |
Note, now all DIZZINESS events are in one line, and only the first one is labeled.
Full SAS 9.3 code: AETimelineByName


1 Comment
Pingback: CandleStick Chart - Graphically Speaking