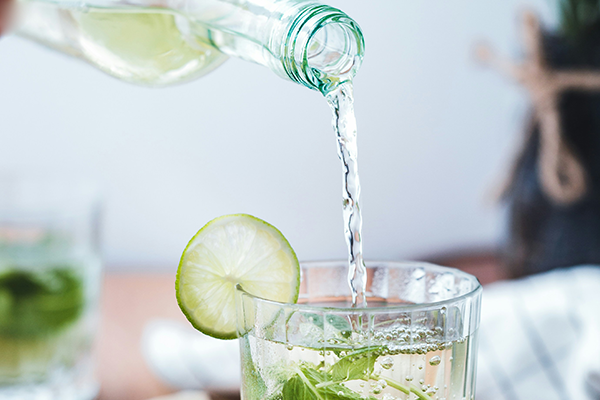
A few of our clients are exploring the use of a data lake as both a landing pad and a repository for collection of enterprise data sets. However, after probing a little bit about what they expected to do with this data lake, I found that the simple use of
English

Choosing nutrient-dense foods is only half the battle when it comes to eating right. The other half is making sure you’re getting the most benefits from your great food choices. How do you do that, you ask? The answer is pretty simple. Paying attention to a few common food prep

Last month I wrote about how to simulate a drunkard's walk in SAS for a drunkard who can move only left or right in one direction. A reader asked whether the problem could be generalized to two dimensions. Yes! This article shows how to simulate a 2-D drunkard's walk, also

There's big money in professional sports these days - we're talking billions of dollars! Do you know which teams are the most valuable? The graphs in this blog will show you... I recently saw a bar chart on dadaviz.com showing the world's most valuable sports teams. It was the right kind

The SASIOLA libname engine is now delivered with most SAS software orders so that we can load LASR environments remotely from separate SAS environments. For example, maybe you have an existing SAS “ETL” machine that you use to access your source environments and load your target environments. With the SASIOLA

Krystian Matusz is what I’d call a super SAS user. He currently holds seven out of the nine credentials SAS offers. SAS Certified Advanced Programmer for SAS 9 SAS Certified Base Programmer for SAS 9 SAS Certified BI Content Developer for SAS 9 SAS Certified Clinical Trials Programmer Using SAS

While I've often written about how to get your SAS data to Microsoft Excel in some automated way, I haven't really addressed what's probably the most frequently used method: copy and paste. SAS Enterprise Guide 7.1 added a nifty little feature that makes copy-and-paste even more useful. The new "Copy
Many people who plan data governance initiatives ignore the need for a business case. "We've already had approval for the project; why do we need a business case when we've got the budget signed off?" The perception is that because they have a strong commitment, there is no need to get

There are many ways to modify the graphs that SAS creates. Standard graph customization methods include template modification (which most people use to modify graphs that analytical procedures produce) and SG annotation (which most people use to modify graphs that procedures such as PROC SGPLOT produce). However, you can also

When using SAS to format a number as a percentage, there is a little trick that you need to remember: the width of the formatted value must include room for the decimal point, the percent sign, and the possibility of two parentheses that indicate negative values. The field width must

Right now I’m crossing the Pacific toward Australia and New Zealand for the 21st ACM SIGKDD Conference on Knowledge Discovery and Data Mining (a.k.a. KDD), a Data Science Melbourne MeetUp, and the SAS Users of New Zealand conference. New Zealand is the birthplace of open source R. So this trip

We all want to customize our graphs just so, and have our personal preferences. Over the past few releases SG Procedures and GTL have added options to customize the look and feel of our graphs. In this article, I will describe new ways in which you can customize your legends. We will also see some
In my previous post I talked to John Cassara about the growing threat of mobile payments and how mobile phones can be used to launder illicit funds globally. I spoke with him again recently on the topic of financial intelligence. Here are the highlights from our discussion. So what is

Support for SAS Users is everywhere! Starting in September, Regional SAS Users Groups host their annual conferences. Through presentations and hands-on workshops, fall regional conferences expose users to new ideas, best practices and innovative ways to use SAS. Attendees also have the opportunity to attend classes and network with hundreds

“Everything in our body is linked”, according to former Surgeon General David Satcher and the past 5 to 10 years have seen ballooning interest in possible links between mouth health and body health. As much as I would simply love to compartmentalize my oral health from my physical fitness, current

Last week's post about odds ratio plots in SAS made me think about a similar plot that visualizes the parameter estimates for a regression analysis. The so-called regression coefficient plot is a scatter plot of the estimates for each effect in the model, with lines that indicate the width of

I've heard lots of people quote statistics about marriage & divorce, but the experts don't always agree on what the data means. So I decided to run the data through a SAS graphical analysis, and see what the numbers say ... Before we get into the numbers though, let's have a

I hauled the Sunday paper in this past weekend. The back-to-school shopping circulars added heft to the normal weight. No surprise--even without the tax free holiday weekend. We're all gearing up for the coming school year whether it be for our kindergartener starting afresh or for our college-bound student leaving home

With apologies to this candy advertisement from the 1980s: "Hey, you got your Lua in my SAS program." "You got your SAS code in my Lua program!" Announcer: "PROC LUA: Two great programming languages that program great together!" What is Lua? It's an embeddable scripting language that is often used

I recently saw a cool graph showing the US import/export trade deficit. But after studying it a bit, I realized I was perceiving it wrong. Follow along in this blog, to find out what the problem was, and how I redesigned the graph to avoid it. I was looking through dadaviz.com

Bigger doesn’t always mean better. And that’s often the case with big data. Your data quality (DQ) problem – no denial, please – often only magnifies when you get bigger data sets. Having more unstructured data adds another level of complexity. The need for data quality on Hadoop is shown by user

Imagine the following scenario. You have many data sets from various sources, such as individual stores or hospitals. You use the SAS DATA step to concatenate the many data sets into a single large data set. You give the big data set to a colleague who will analyze it. Later

If you are familiar with the output delivery system (ODS), then you know that you can modify the tables and graphs that analytical procedures display by modifying table and graph templates. Perhaps less familiar is the fact that you can also modify dynamic variables. Tables and graphs are constructed from

In my quest for interesting data to graph, I found some Drug Enforcement Administration (DEA) data on US domestic cannabis eradication. Does the data say anything interesting? Read on to find out! ... While doing some searches for other data, I happened across a table on the DEA website titled

Encryption and SAS is a wide ranging topic – so wide it gets its own book and features strongly in both the SAS(R) 9.4 Intelligence Platform: Security Administration Guide, Second Edition and SAS(R) 9.4 Intelligence Platform: Middle-Tier Administration Guide, Third Edition. In this blog we’ll take a high level look at

Last week, SAS released the 14.1 version of its analytics products, which are shipped as part of the third maintenance release of 9.4. If you run SAS/IML programs from a 64-bit Windows PC, you might be interested to know that you can now create matrices with about 231 ≈ 2

SAS 9.4 Maintenance release 3 was released on July 14. The ODS Graphics procedures include many important, useful and cool features in this release, some that have been requested by you for a while. In the next few articles, I will cover some of these features. Last time I covered

There's been quite a bit of controversy about the number of undocumented immigrants in the US lately - for example, Ann Coulter claims that number is 30 million, whereas others claim it's about 11 million (readers of my blog are data-savvy, and would dig into the details of such claims,

I returned to work from a 2+ week vacation this morning. When I fired up SAS Enterprise Guide (as I do each work day and occasionally on weekends), I was greeted with this message: As a SAS insider, I knew this was coming. It's a new feature that was added