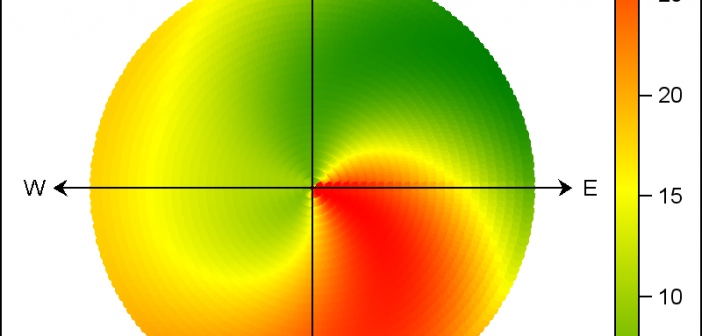
There are many situations where it is beneficial to display the data using a polar graph. Often your data may contain directional information. Or, the data may be cyclic in nature, with information over time by weeks, or years. The simple solution is to display the directional or time data
Tag: GTL
I have written a new book: Basic ODS Graphics Examples. It is available as a free PDF file on the web. It is in color, and all of the SAS code is available by double clicking a link at the beginning of each example. This new book complements my other
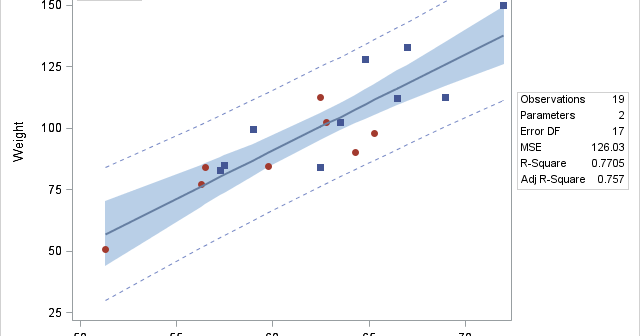
A customer wants to use PROC REG to fit a simple regression model but display in the fit plot markers that differentiate groups of individuals. Click on a graph to enlarge. Before we see how to do that, let's look at some simpler examples. The following step fits a linear
Let us start the new year by taking a trip back in history to SAS 9.2, first released in 2008, and the first SAS release that included the new ODS Graphics software including GTL and SG procedures. While we have recently released the third maintenance on SAS 9.4 (SAS 9.40M3),
I have written a new book on advanced ODS Graphics examples. It is available as a free PDF file on the web. It is in color, and all of the SAS code is available by double clicking a link at the beginning of each example. Advanced ODS Graphics Examples Update:
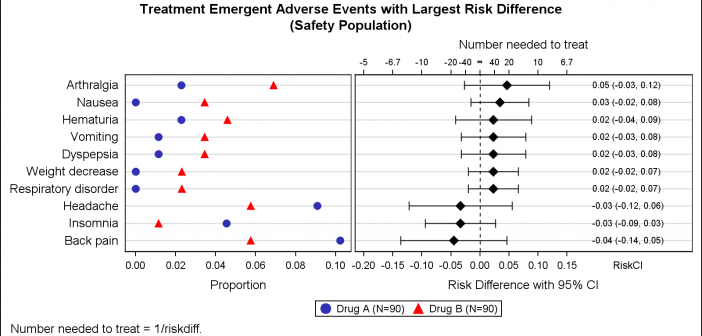
Early last year I wrote an article on how to create the "Most Frequent Adverse Events Sorted by Relative Risk" graph using the SGPLOT procedure. The key issue here is that such a graph normally displays two plots side by side, a scatter plot of the proportion values by treatment
In the past few weeks, I have written two posts on SG annotation and on saving and then modifying the graphs that analytical procedures produce: Modifying dynamic variables in ODS Graphics Annotating graphs from analytical PROCs Today, I finish this series with one more post. This one shows how you
There are many ways to modify the graphs that SAS creates. Standard graph customization methods include template modification (which most people use to modify graphs that analytical procedures produce) and SG annotation (which most people use to modify graphs that procedures such as PROC SGPLOT produce). However, you can also
PharmaSUG 2015 in Orlando was held at the Renaissance had a record breaking attendance of over 650. Weather was great, except for a huge downpour on the evening of the last day. All the popular presenters were in attendance including Art Carpenter, Kirk Lafler, Arthur Li and many others. Presentations
MicroMaps are a powerful way to display data where the display includes small, lightweight maps to provide geographical information regarding the data. This geographical information gives clues to the relationship between the data that could lead to more insight. The SAS SG Procedures and GTL do not currently have built-in