I wrote “Business Transformation” to guide leaders through a journey to transform their organizations. I included methodologies and examples gathered throughout my 29-year consulting career to assist them. Every executive and leader focuses on how to use resources to produce value. Of course, value can be defined in many terms
Uncategorized
“Correlation does not imply causation” is a saying commonly heard in science and statistics emphasizing that a correlation between two variables does not necessarily imply that one variable causes the other. One example of this is the relationship between rain and umbrellas. People buy more umbrellas when it rains. This
Since my opening blog post about our new partnership with British Rowing and the GB Rowing Team, I’ve had a deep dive into their data, and we’re now close to our first key milestone – having all the data about a rower in a single location, so we can then
SAS/IML 13.1 includes a handy function for programmers who write a lot of modules. The PARENTNAME function obtains the name of the symbol that was passed in as a parameter to a user-defined module. How is this useful? Well, suppose that you want to create a SAS/IML module that prints
SAS has been developing "secret sauce" technology for more than 38 years. Whether it has to do with being platform independent, processing in-database, running across a grid, or analyzing data in-memory like our SAS LASR Analytic Server or our High Performance Analytics offerings, secret sauce makes everything taste or, in
At most banks, data is stored in separate databases and data warehouses. Customer data is stored in marketing databases, fraud analyses are done on transactional data, and risk data is stored in risk data warehouses. Oftentimes even liquidity, credit, market, and operational risk data is stored separately as well. Bringing
Part 1: The challenge and the opportunity Mental illness continues to profoundly affect the nation’s population and, for the most part, remains greatly under analyzed. This is the first entry in a series about the mental health problem in the US, and how an analytic approach can improve care for
It’s no secret that SAS is a constant among Best Places to Work lists all over the world. But, what many may not realize is the connection between creating a company employees want to work for, and creating a company customers want to work with.
Sales and Operations Planning (S&OP) started out with big aspirations. As initially conceived, S&OP was to cover the entire domain now called Integrated Business Planning (IBP). As S&OP process implementations rolled out during the 1980’s, this broad scope turned out to be a bit much to attempt in one bite. S&OP
Next week Breffni Noone, Associate Professor, The Pennsylvania State University and I will be hosting a discussion at the Cornell Hospitality Research Summit on how user generated content impacts the purchase choices of the unmanaged business traveler. The discussion will take place on Monday October 13 at 2:15pm in Statler 396.
In the first installment of this series on Hadoop, I shared a little of Hadoop's genesis, framing it within four phases of connectivity that we are moving through. I also stated my belief that Hadoop has already arrived in the mainstream, and we are currently moving from phases three of connecting people to phase four
In response to my recent post about how to use the PALETTE function in SAS/IML to generate color ramps, a reader wrote the following: The PALETTE function returns an array of hexadecimal values such as CXF03B20. For those of us who think about colors as RGB values, is there an
One of the hottest trends today in the business intelligence and analytics spaces is “self-service.” The word self-service is thrown around lightly in many situations and often carries different expectations for different people and organizations. Before we go into the details of self-service analytics it is important to have a
When I visit with customers or potential clients, they often ask, "Where do I start in order to get a handle on my supply chain?" There is no clear and concise answer, but I usually say "Follow the inventory!" Inventory is a result of decisions made. It is not the
Is the type of car you drive more likely, or less likely, to get a speeding ticket? Let's analyze some data to find out! Do red cars attract more attention from the police, and get more tickets? How about cars with a 'racing stripe'? Or cars with a big chromed motor,
Double, double toil and trouble; Fire burn, and caldron bubble. Macbeth, Act IV, Scene I For the cyptanalyst or recreational puzzle solver, "double double" does not lead to toil or trouble. Just the opposite: The occurrence of a double-letter bigram in an enciphered word puzzle is quite fortunate. Certain double
Digital banking is not just a futuristic concept anymore. In fact, some banks are making great progress towards digital banking and social banking, like Citibank, as I described in my previous blog post. But what does this mean for regulatory compliance? Should digital banks have the same regulatory compliance as
.@philsimon on the proliferation of "as a service" terms.
Have you heard the old saying that "Banks only loan money to people who don't need it"? Let's analyze the data and see if that is true!... I'm very much a car-guy, and I love learning about all the new vehicles, and love the new-car feel ... and even the smell. It's hard to not like a
So, you've heard the Hadoop hype and you are looking – or have already invested – into Hadoop. Maybe you have also realized some benefits from the Hadoop ecosystem. But now you want to maximize those benefits by using advanced analytics, or you might have heard about algorithms or machine learning libraries available
Tal vez usted es de los que se preguntan cómo usan su tiempo algunos cargos en las empresas. Normalmente esto ocurre debido al desconocimiento por parte de los equipos sobre el rol de áreas diferentes a las suyas y más aún, cuando son muy especializadas. En esta oportunidad, hablaremos del
Have you ever looked as a statistical graph that uses bright garish colors and thought, "Why in the world did that guy choose those awful colors?" Don't be "that guy"! Your choice of colors for a graph can make a huge difference in how well your visualization is perceived by
Would you build a house without a proper foundation? Most of us wouldn’t dare, but that’s exactly what many retail businesses are doing today. When building a house, if you don’t get the foundation right, paint, wallpaper and fixtures won’t matter much. It’s no different in the retail industry. Success
A few weeks back I noted that one of the objectives on an inventory process for reference data was data harmonization, which meant determining when two reference sets refer to the same conceptual domain and harmonizing the contents into a conformed standard domain. Conceptually it sounds relatively straightforward, but as
Whether it’s to reduce churn in competitive markets or to elevate customer satisfaction rankings in regulated markets, customer analytics is hot right now in utilities. However, the complexity that utilities have built into their processes and technologies over the past decades makes customer analytics a more challenging issue to tackle
The panel moderator looks out over the audience. It’s a large crowd. For the first time ever, Big Data, Hadoop, and the Internet of Things are appearing on stage together. The conversation has just begun, so let’s listen in for a minute. Big Data: “…and people have been trying to
In the world of IT, very few new technologies emerge that are not built on what came before, combined with a new, emerging need or idea. The history of Hadoop is no exception. To understand how Hadoop came to be, we therefore need to understand what went before Hadoop that led to its creation. To understand
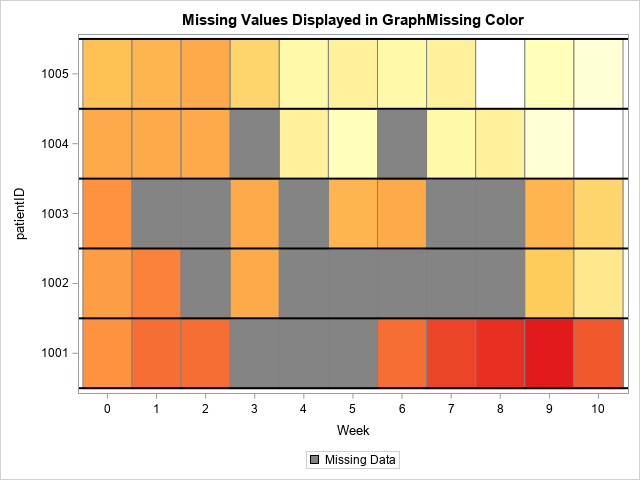
In a previous article I introduced the HEATMAPCONT subroutine in SAS/IML 13.1, which makes it easy to visualize matrices by using heat maps with continuous color ramps. This article introduces a companion subroutine. The HEATMAPDISC subroutine, which also requires SAS/IML 13.1, is designed to visualize matrices that have a small
In guest lectures I give at universities, I often refer to the Harvard Business Review report which states that being a Data Scientist is the sexiest job of the 21st century. Naturally, this always seems to capture the students’ attention, and drives their enthusiasm to sit up and listen carefully.