All Posts


SAS-based processes are critical to many organizations, but sometimes the trickiest part of your job falls into one or both of these activities: Getting stuff from the outside world "into" SAS. (Once it's in SAS, as many of you know, the world is your oyster.) Getting the output of your
The 2011 Joint Statistical Meetings (JSM) will be from July 31-August 3 in Miami Beach. Look for acquisitions editor and SAS Press conference mega-maven Shelley Sessoms at the SAS Publishing booth (#504). Shelley can talk with you about: New and forthcoming statistics-related books from SAS Press, including Statistical Analysis for


Policing has profoundly changed over the last several decades and its evolution will continue as long as there are crimes to commit and communities to serve. The very nature of policing is dynamic – it always has been and always will be. Those dynamics are driven by many things –

SAS Enterprise Guide has about 150 options that you can customize in the Tools->Options window. With each release, the development team adds a few more options that have been asked for by customers, and they rarely decommission any existing options. It's getting quite crowded on some of those options windows!


As I write my first blog entry for SAS State and Local Government, I thought it would be prudent to provide a little personal background. I grew up in a family of artists- with 5 musicians, 2 painters, 1 sculptor, 1 dancer, and 1 composer. I studied business, became a

I hope that the following statement is not too controversial...but here it goes: Microsoft Excel is not a database system. That is, I know that people do use it as a database, but it's not an application that supports the rigor and discipline of managing data in the same way
It's a simple task to use SAS to compute the number of weekdays between two dates. You can use the INTCK function with the WEEKDAY interval to come up with that number. diff = intck('WEEKDAY', start_date, end_date); If you want to compute the number of working days between two dates,

SAS Enterprise Guide is best known as an interactive interface to SAS, but did you know that you can use it to run batch-style programs as well? SAS Enterprise Guide has always offered an automation object model, which allows you to use scripting languages (such as VBScript or Windows PowerShell)


The Credit Card Accountability, Responsibility and Disclosure Act (CARD) of 2009 was triggered by the financial crisis and designed to protect subprime borrowers by forcing lenders to provide more transparency and more reasonable, fairer rates and fees to borrowers. This has proven a costly burden for US lenders as they
Congratulations to Curt Hinrichs and Chuck Boiler! Their book, JMP Essentials: An Illustrated Step-by-Step Guide for New Users, has won an Award of Distinguished Technical Communication in this year’s International Summit Awards presented by the Society for Technical Communication. The award goes to a project that “applies the principles of
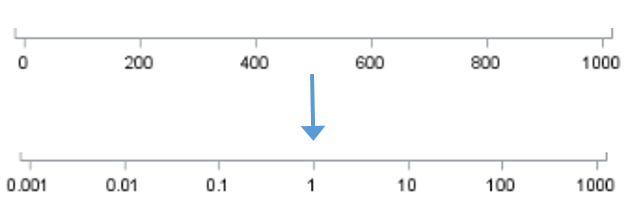

The log transformation is one of the most useful transformations in data analysis. It is used as a transformation to normality and as a variance stabilizing transformation. A log transformation is often used as part of exploratory data analysis in order to visualize (and later model) data that ranges over

This is a guest post from Jodi Blomberg, a Principal Technical Architect at SAS. She has over 12 years of experience in data mining and mathematical modeling, and has developed analytic models for many government agencies including child support enforcement, insurance fraud, intelligence led policing, supply chain logistics and adverse

Unless you’ve been living under a rock, you’ve heard about the budget problems running rampant across all levels of government. Federal, State and Local Governments are all facing historic budget shortfalls due to the economic crisis and decreased tax receipts. This has led to a much closer examination of services
Contributed by Angela Hall, Senior Technical Architect at SAS, (@angelahall1) The SAS Global Forum Technology Session included the technically funny comedian Don McMillan , who pulled out the #SASGF11 program and stated, very seriously, that there was plenty of comedy material within those pages. He then highlighted the long and
This morning I delivered a talk to visiting high school students at the SAS campus. The topic: using SAS to analyze Twitter content. Being teenagers, high school students are well familiar with Twitter. But this batch of students was also very familiar with SAS, as they all have taken SAS